


*The City of Chicago Market Snapshot represents the residential real estate activity within the 77 officially defined Chicago community areas as provided by the Chicago Association of REALTORS®.
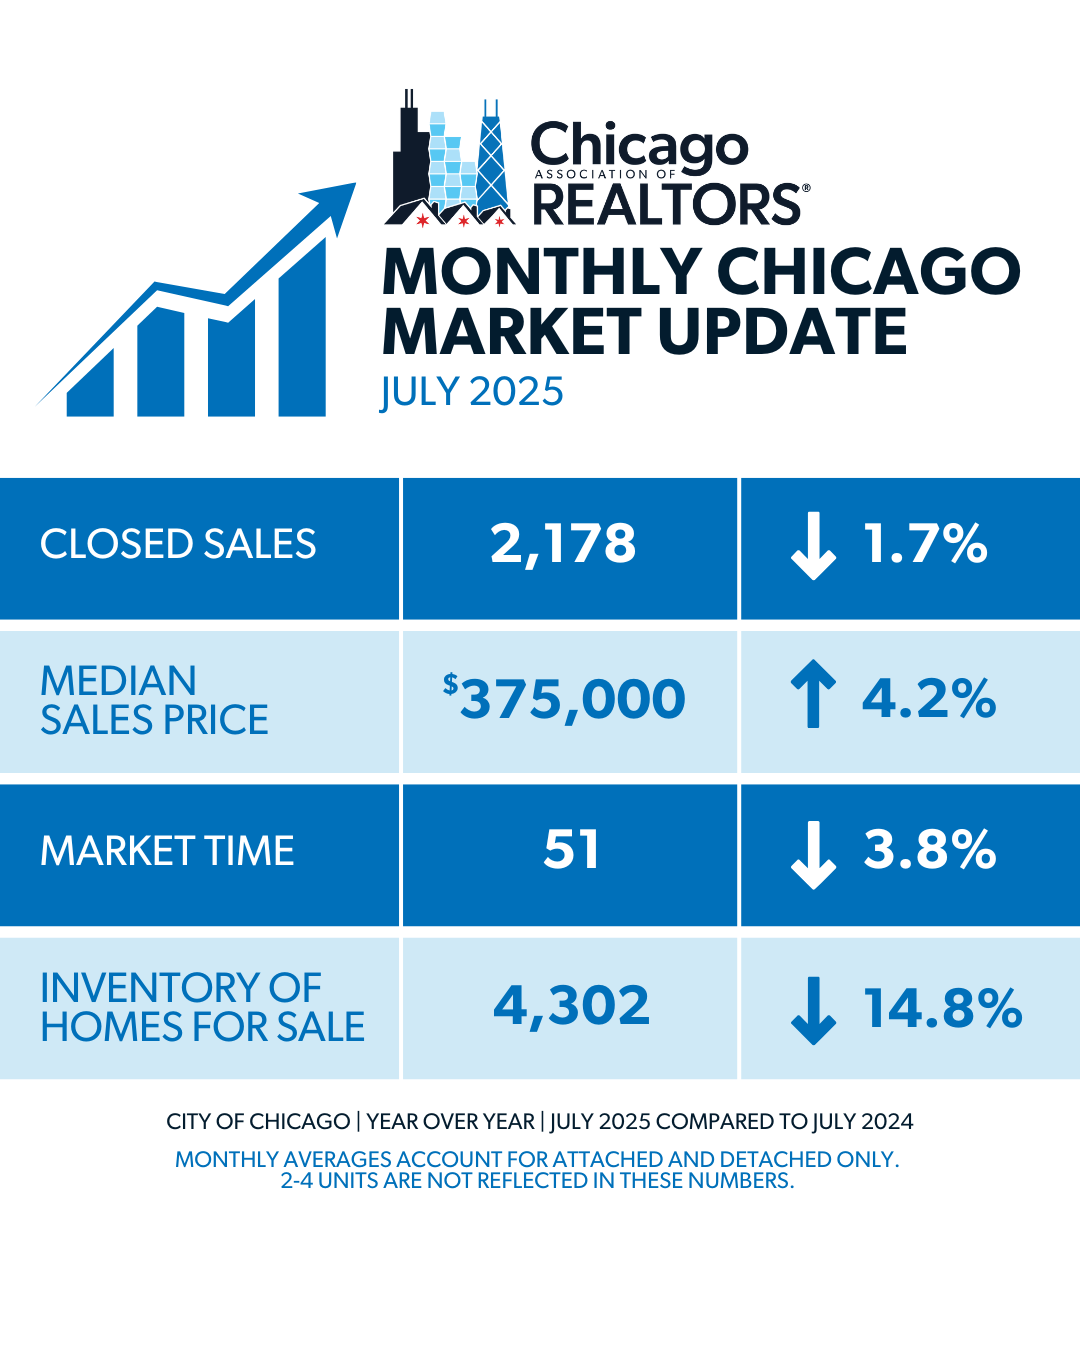
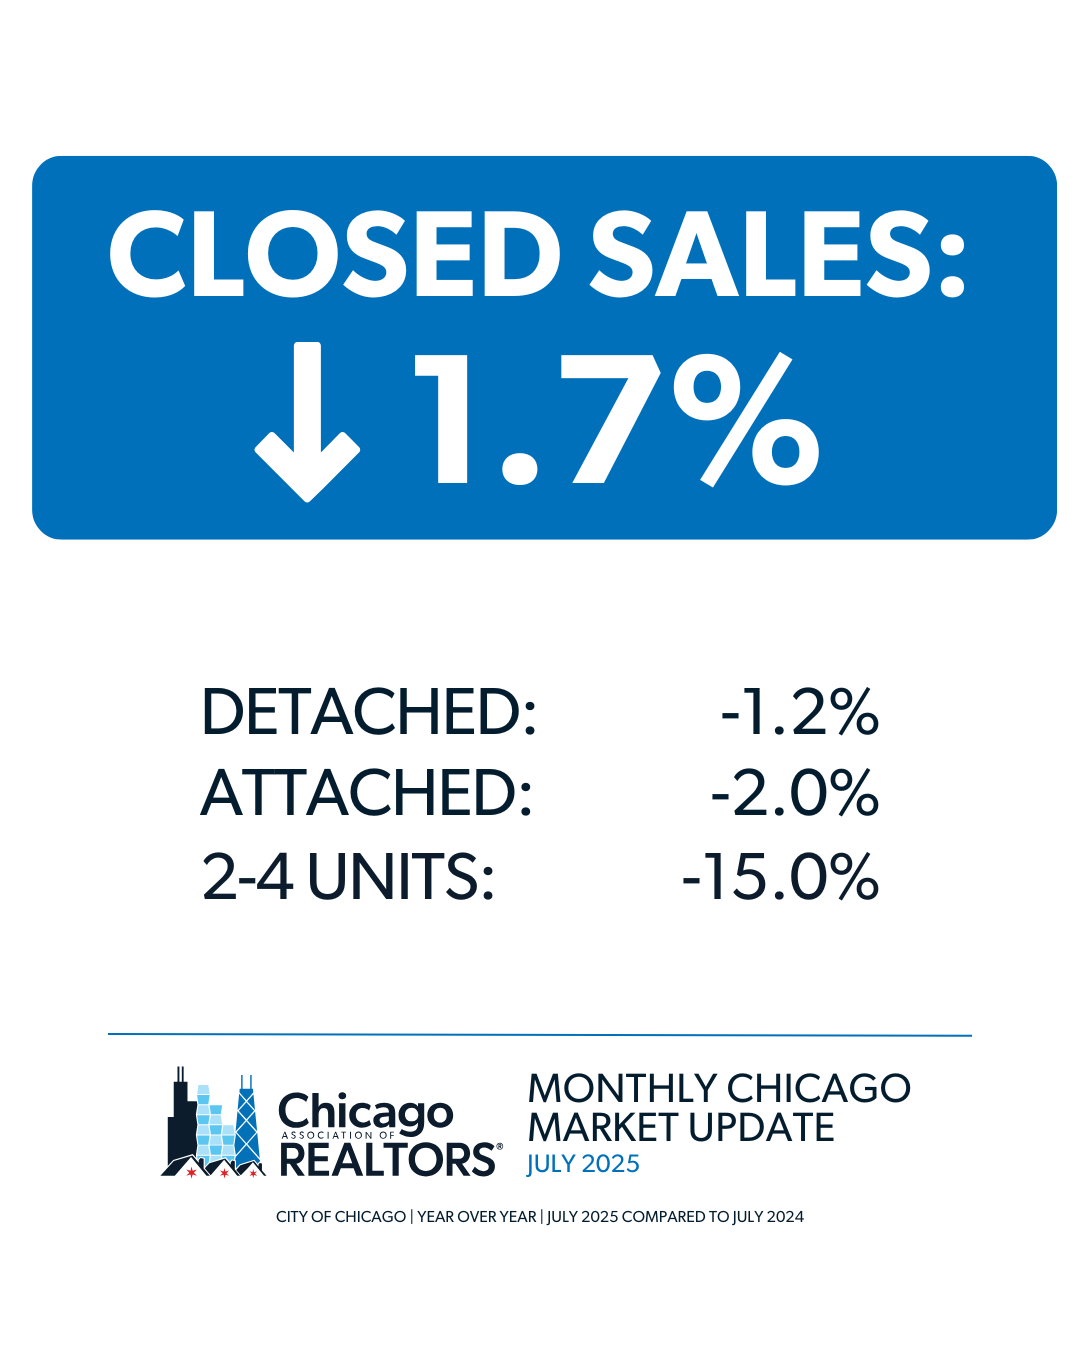
- 2,178 properties were sold in the City of Chicago in July 2025. This is a 1.7% decrease from July 2024.
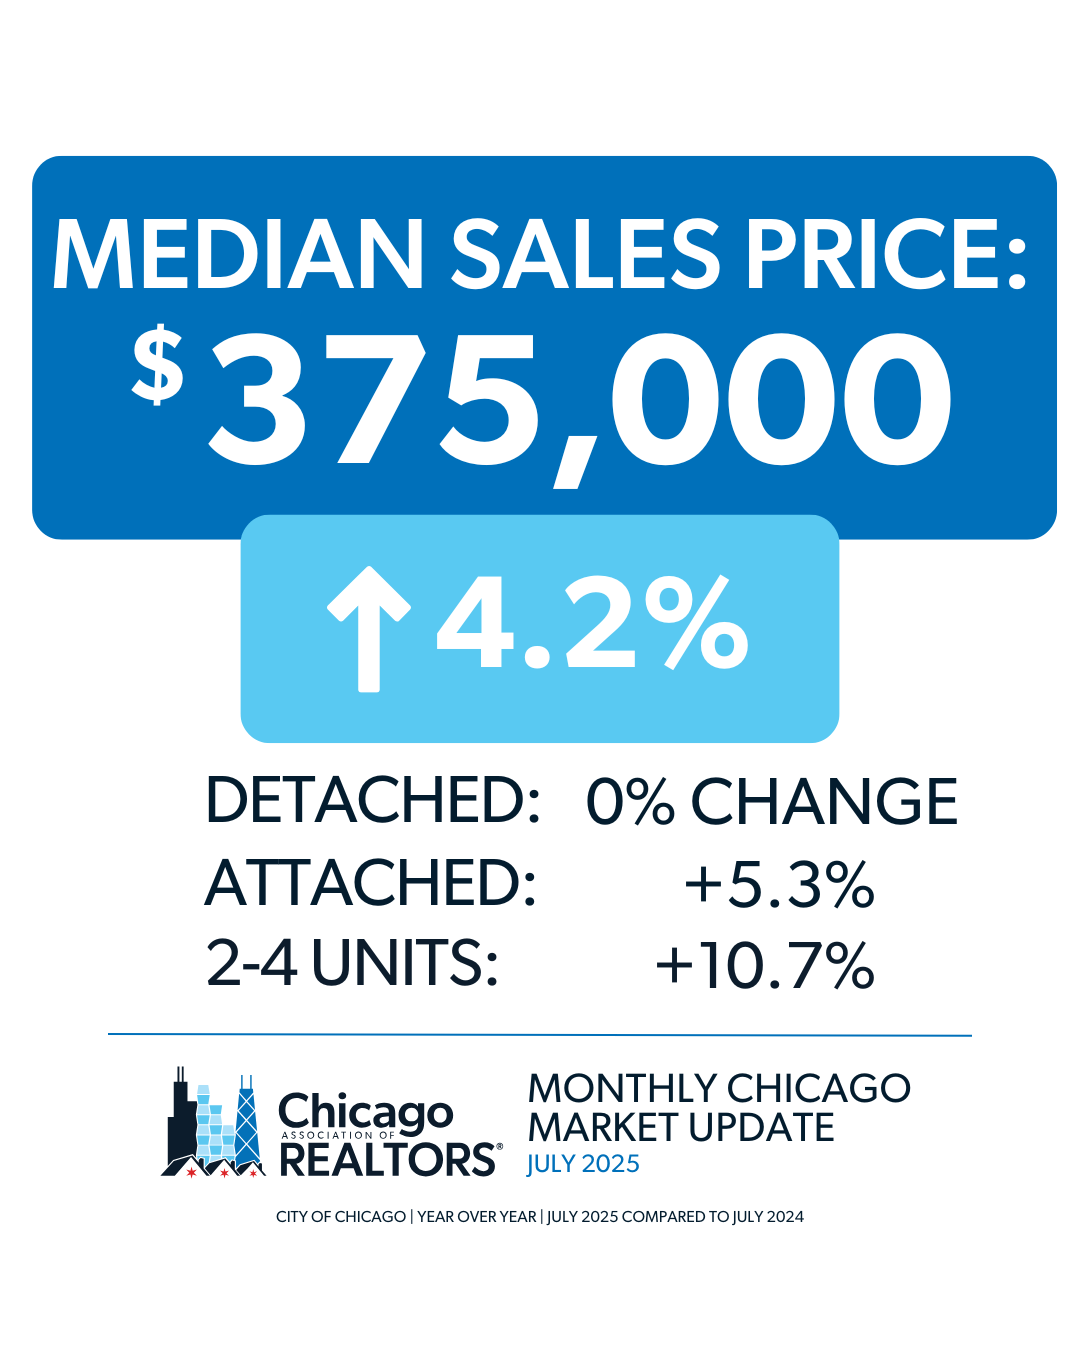
- The median sales price in the City of Chicago for July 2025 was $375,000, which is a 4.2% increase from July 2024.
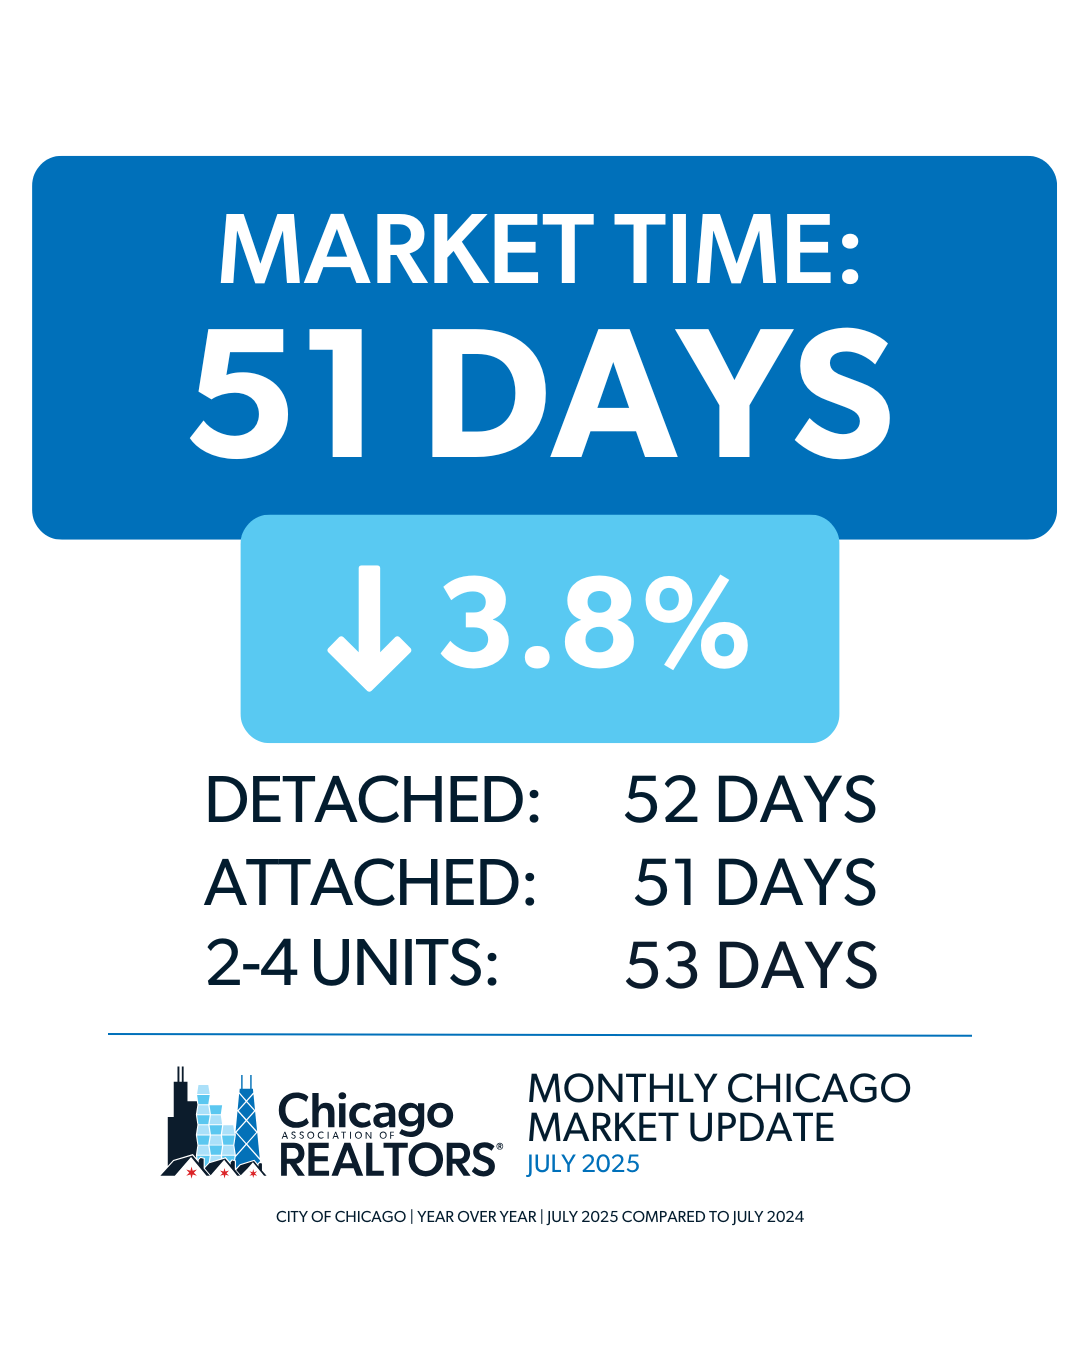
- The City of Chicago saw listings average 51 days on the market until contract, which is a 3.8% decrease from July 2024.
- Check out the July 2025 FastStats.
STATE OF THE MARKET
- U.S. existing-home sales fell 2.7% from the previous month to a seasonally adjusted annual rate of 3.93 million, according to the National Association of REALTORS® (NAR). Sales were unchanged from one year earlier. Regionally, monthly sales declined in the Midwest, Northeast, and South but rose in the West. Year-over-year, sales decreased in the Northeast and West but increased in the South and Midwest.
- Nationally, the median existing-home sales price rose 2.0% year-over-year to $435,300, a new monthly high and the 24th consecutive month of annual price gains, according to NAR. Slower sales activity has contributed to rising inventory this year, with 1.53 million properties listed for sale heading into July, a 15.9% increase from the same time last year and equivalent to a 4.7-month supply at the current sales pace.
INVENTORY
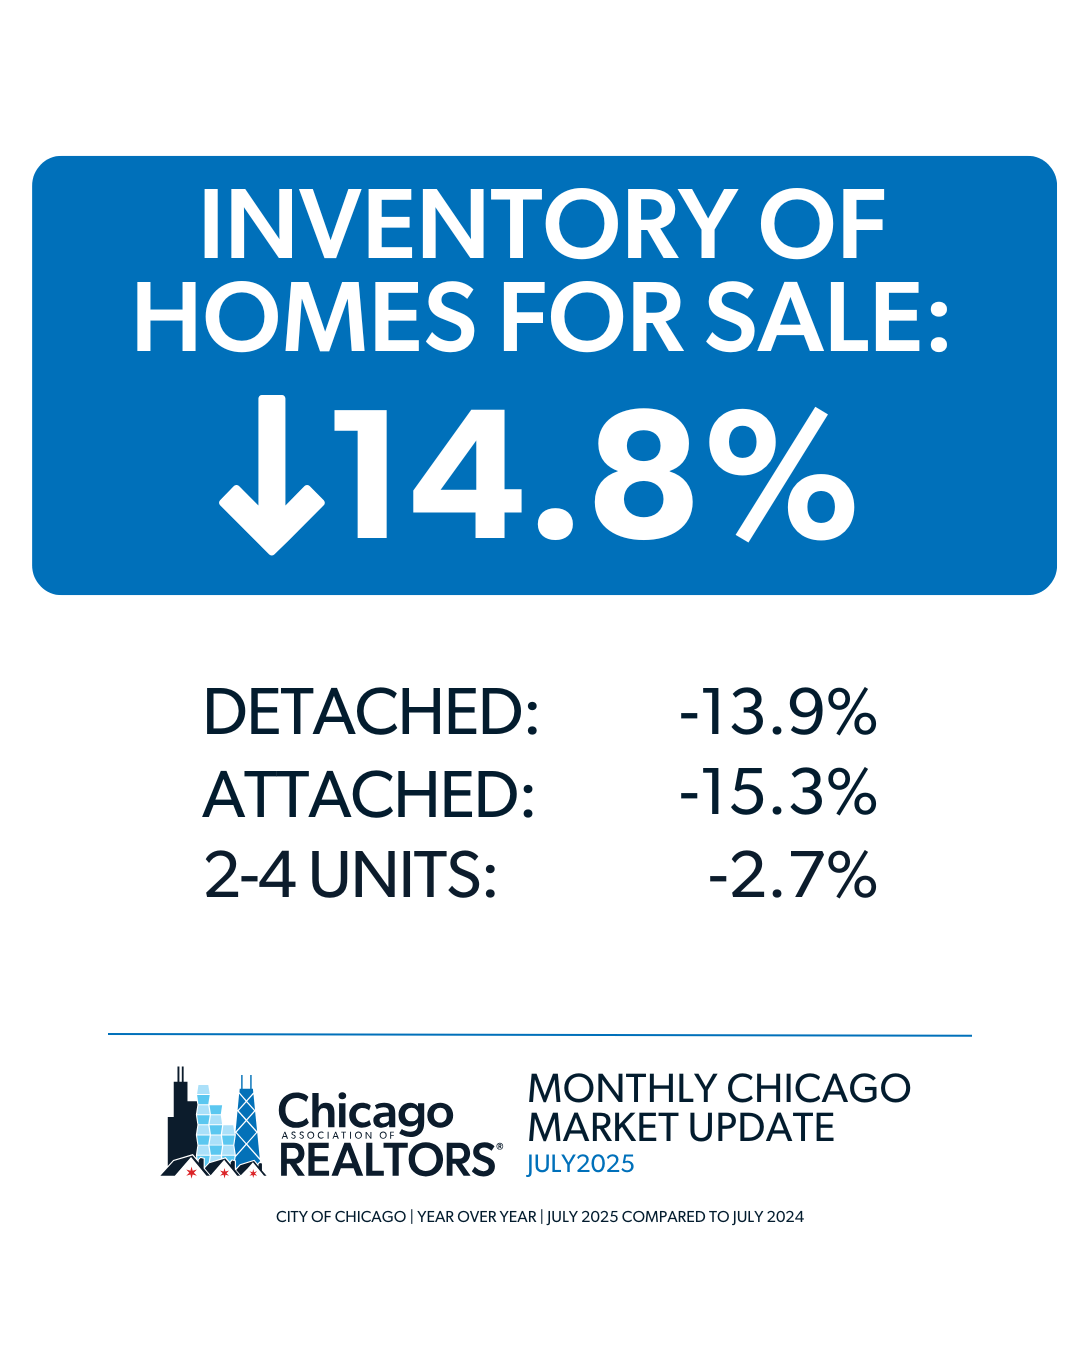
- The City of Chicago’s inventory is down 14.8%, from 5,052 homes in July 2024 to 4,302 homes in July 2025.
- The month’s supply of inventory decreased 17.9%, from 2.8 in July 2024 to 2.3 in July 2025.
2-4 Unit Data
- 277 properties were sold in July 2025. This is a 15.0% decrease from July 2024.
- The median sales price in June 2025 was $459,500, a 10.7% increase from July 2024.
- There were 588 new units on the market in July 2025, which is a 2.7% decrease from July 2024.
If you’re interested in exploring all the 2-4 unit data, check out our monthly spreadsheets in the Chicago-MU tab.