


*The City of Chicago Market Snapshot represents the residential real estate activity within the 77 officially defined Chicago community areas as provided by the Chicago Association of REALTORS®.
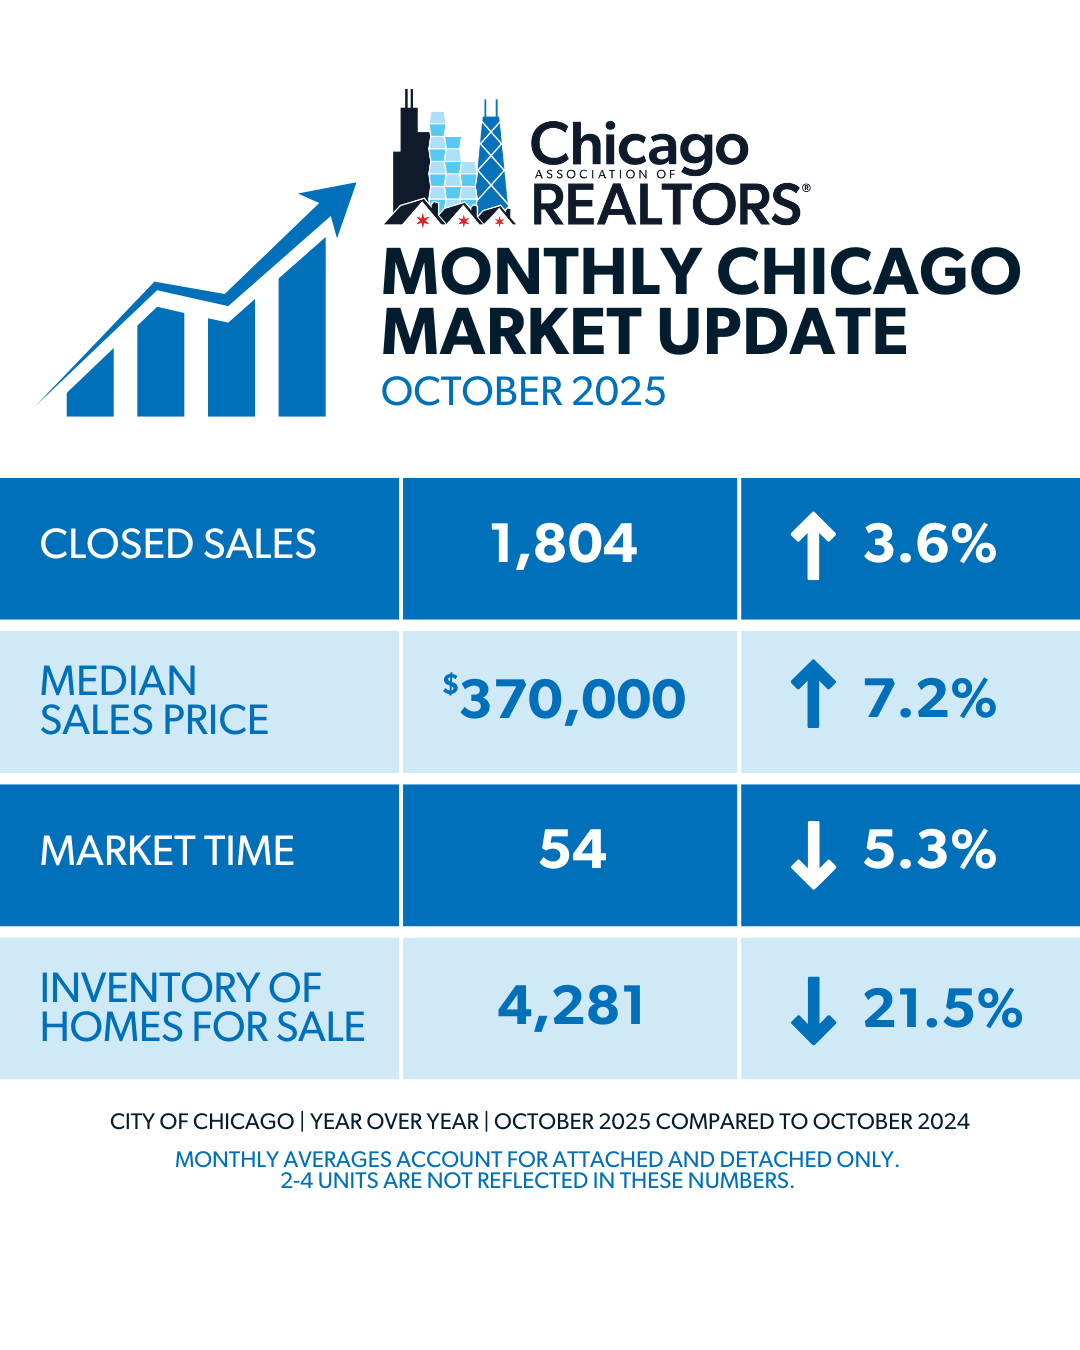
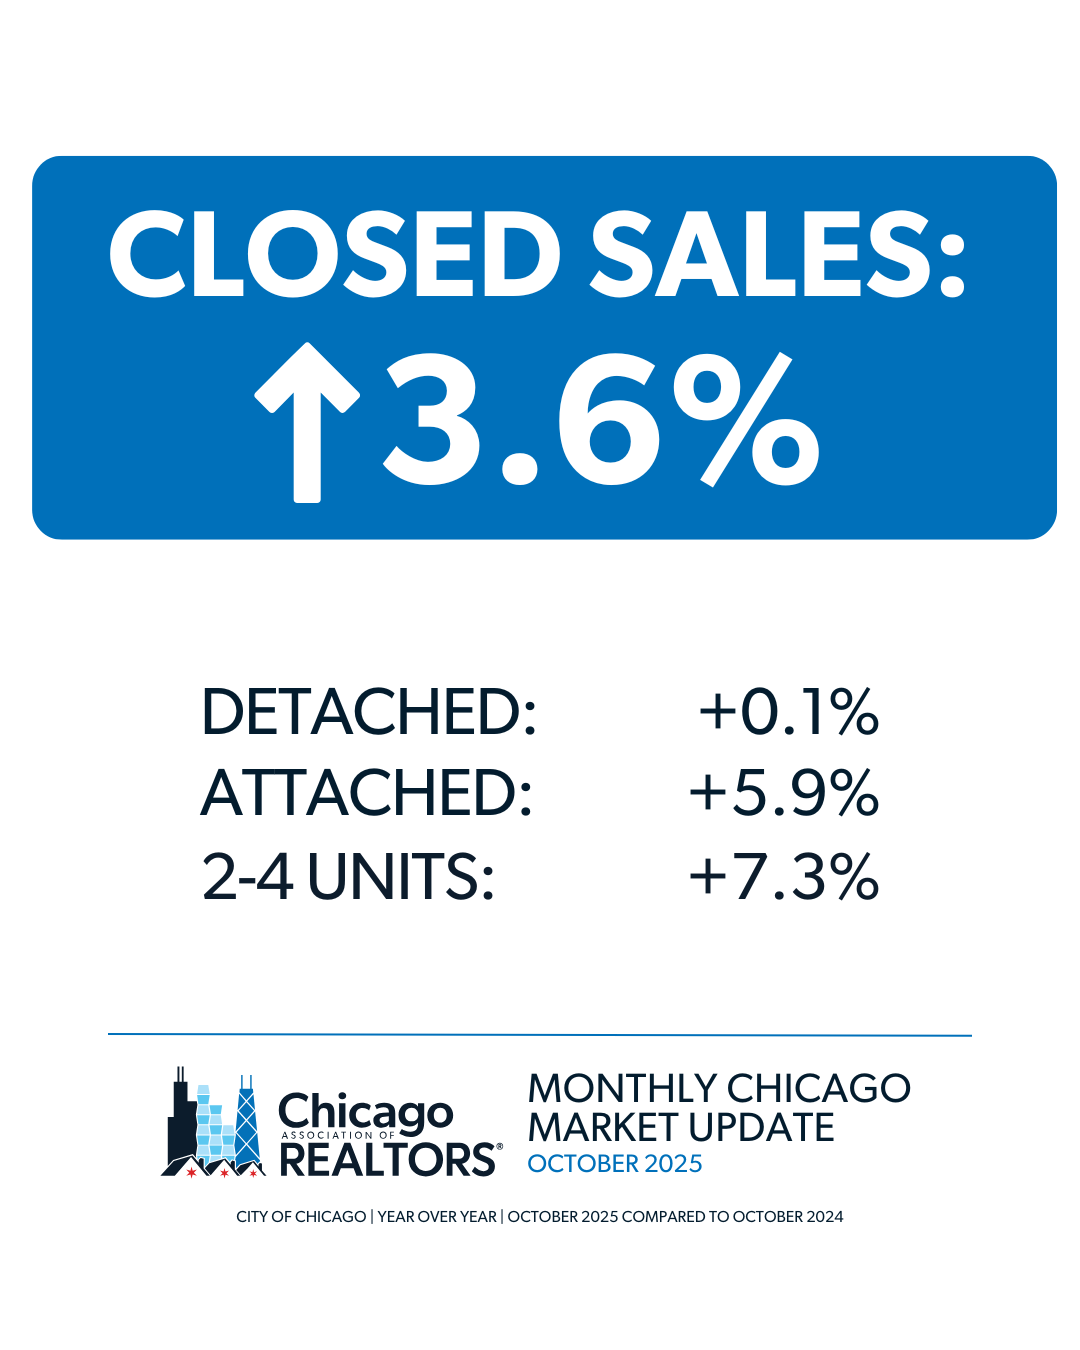
- 1,804 properties were sold in the City of Chicago in October 2025. This is an 3.6% increase from October 2024.
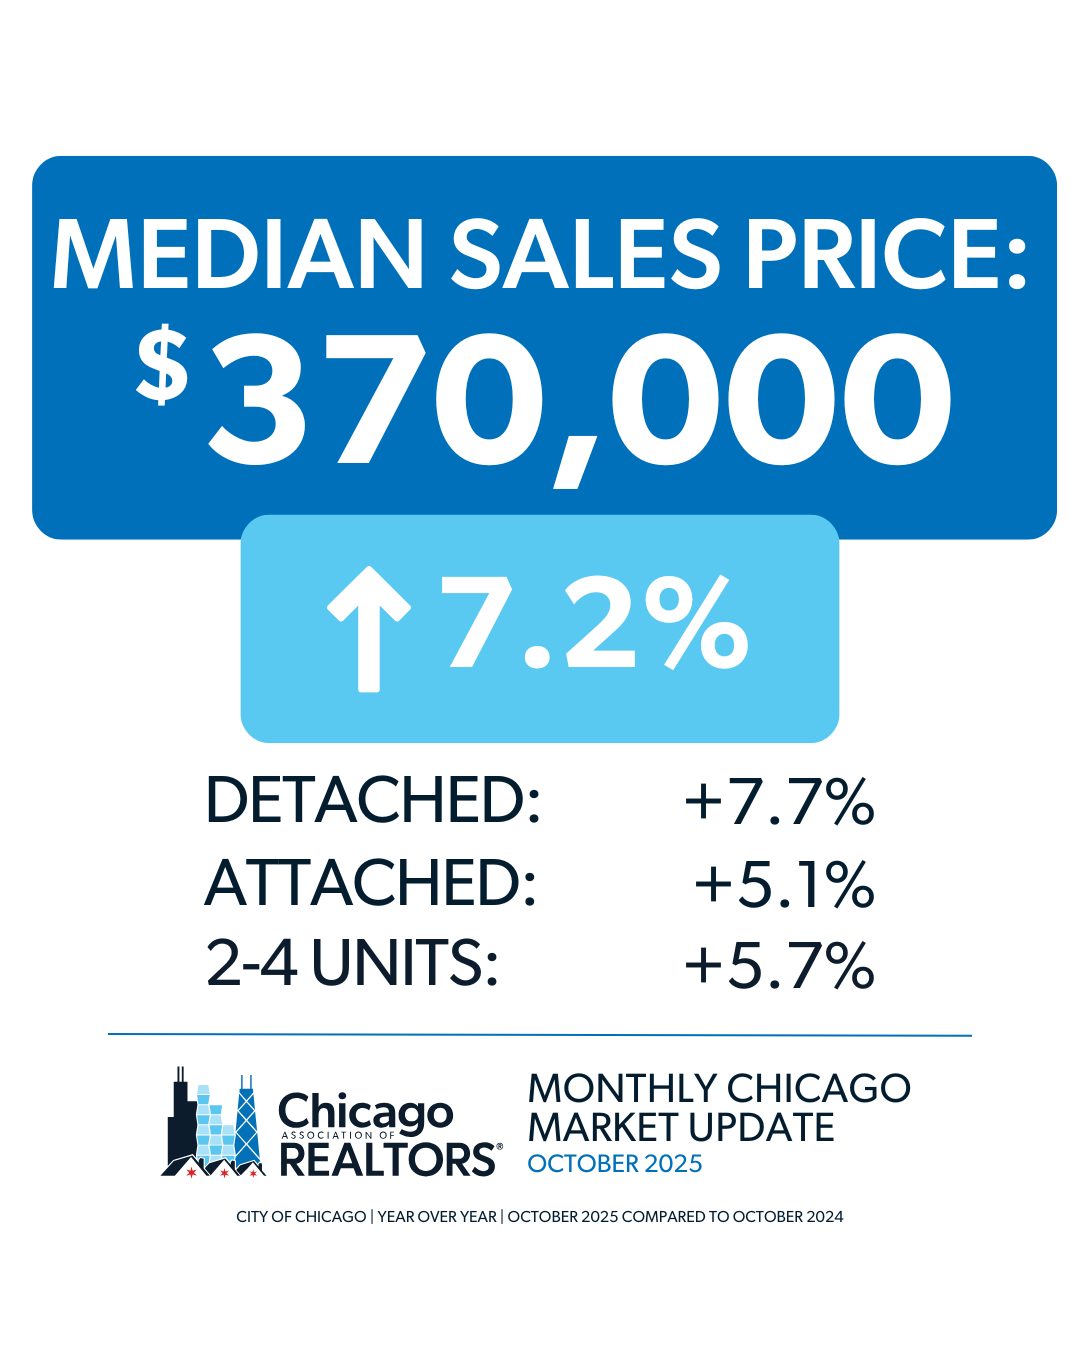
- The median sales price in the City of Chicago for October 2025 was $370,000, which is a 7.2% increase from October 2024.
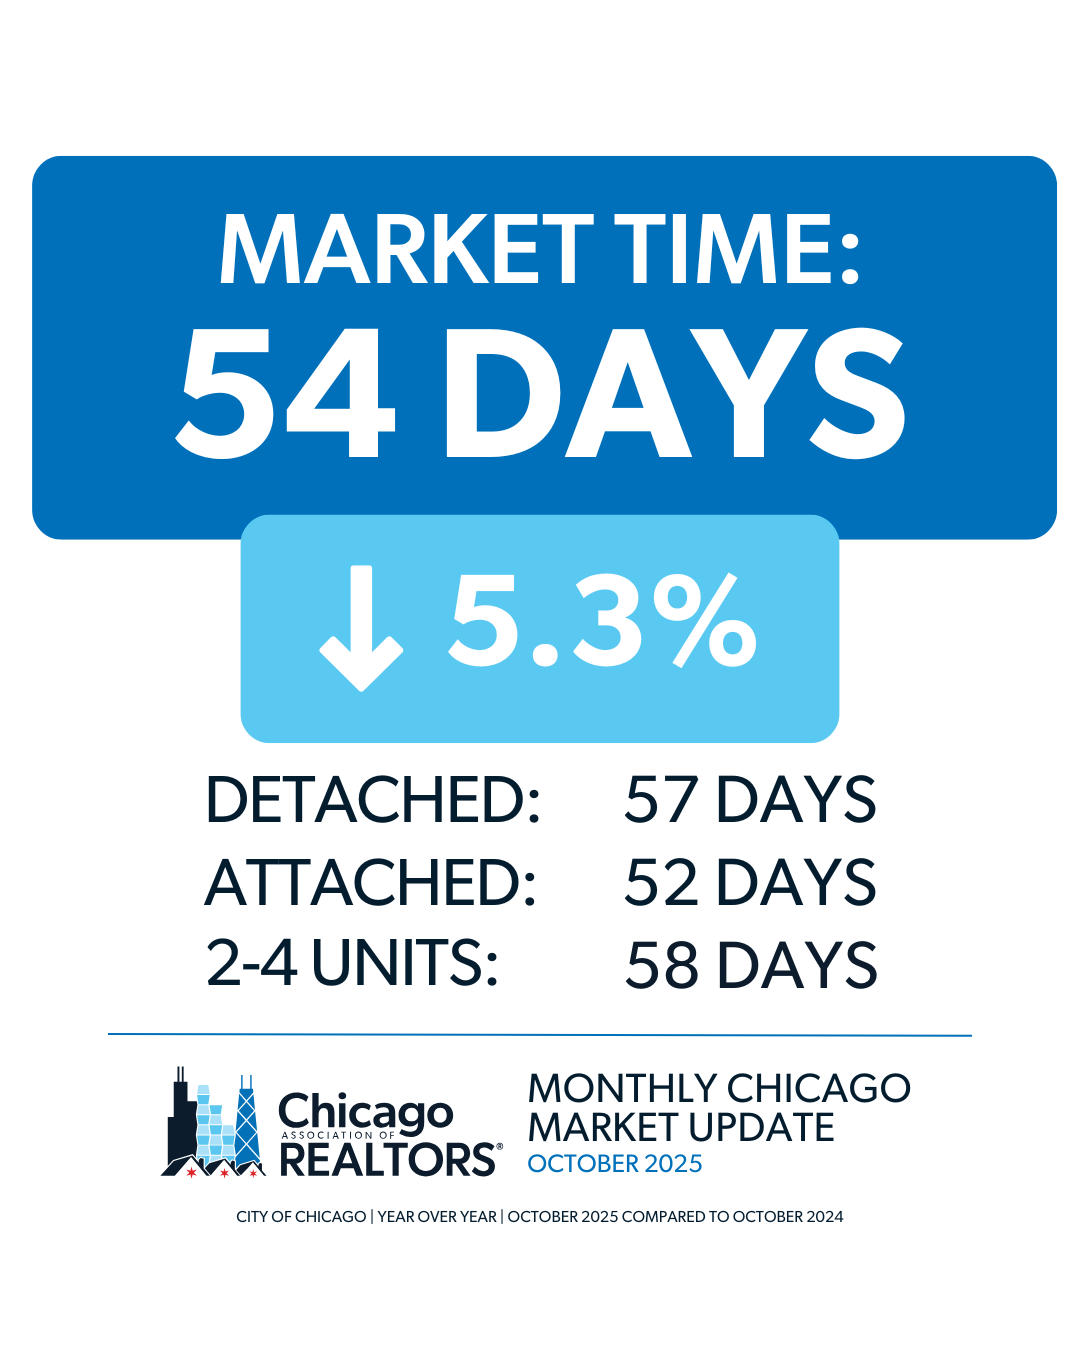
- The City of Chicago saw listings average 54 days on the market until contract, which is a 5.3% decrease from October 2024.
- Check out the October 2025 FastStats.
STATE OF THE MARKET
- U.S. existing-home sales climbed 1.5% month-over-month and 4.1% year-over-year, reaching a seasonally adjusted annual rate of 4.06 million units, according to the National Association of REALTORS® (NAR). The increase was partly driven by falling mortgage rates, which recently hit their lowest level in more than a year. Regionally, monthly sales advanced in the Northeast, South and West, while the Midwest experienced a slight decline.
- Housing inventory edged up 1.3% from the previous month to 1.55 million units, 14.0% higher than the same period last year. This represents a 4.6-month supply at the current sales pace, according to NAR. The median existing-home price grew 2.1% year-over-year to $415,200, continuing the trend of annual price gains. The Midwest saw the largest year-over-year increase in median sales price, followed by the Northeast and South, while prices remained mostly flat in the West.
INVENTORY
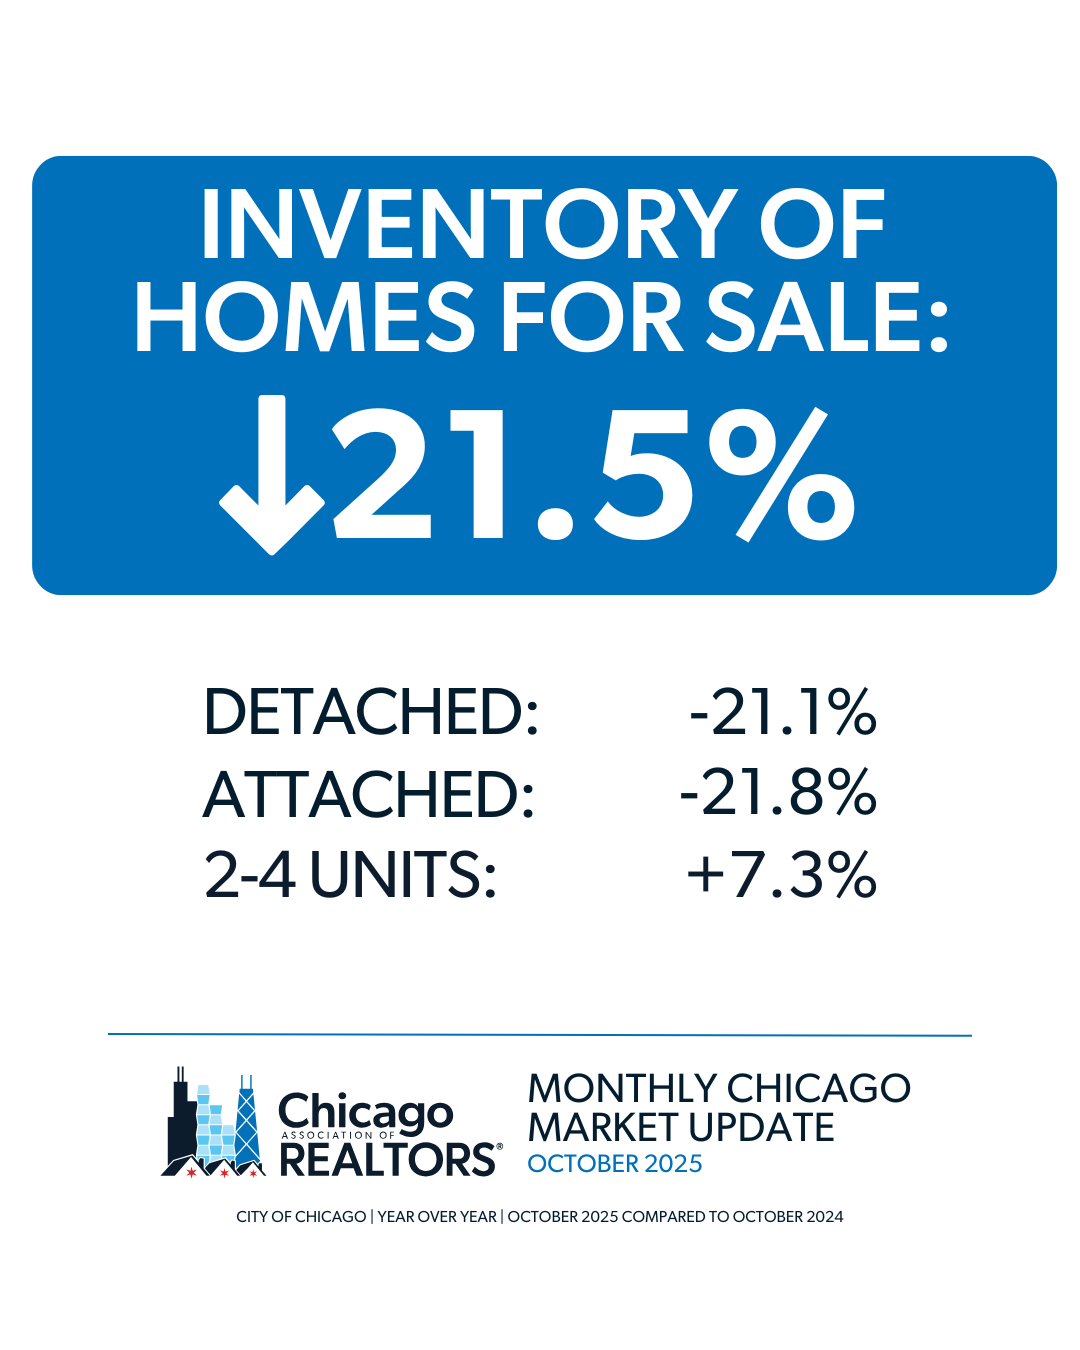
- The City of Chicago’s inventory is down 21.5%, from 5,454 homes in October 2024 to 4,281 homes in October 2025.
- The month’s supply of inventory decreased 23.3%, from 3.0 in October 2024 to 2.3 in October 2025.
2-4 Unit Data
- 324 properties were sold in October 2025. This is a 7.3% increase from October 2024.
- The median sales price in October 2025 was $425,000, a 5.7% increase from October 2024.
- There were 589 new units on the market in October 2025, which is a 1.2% increase from October 2024.
If you’re interested in exploring all the 2-4 unit data, check out our monthly spreadsheets in the Chicago-MU tab.