


*The City of Chicago Market Snapshot represents the residential real estate activity within the 77 officially defined Chicago community areas as provided by the Chicago Association of REALTORS®.
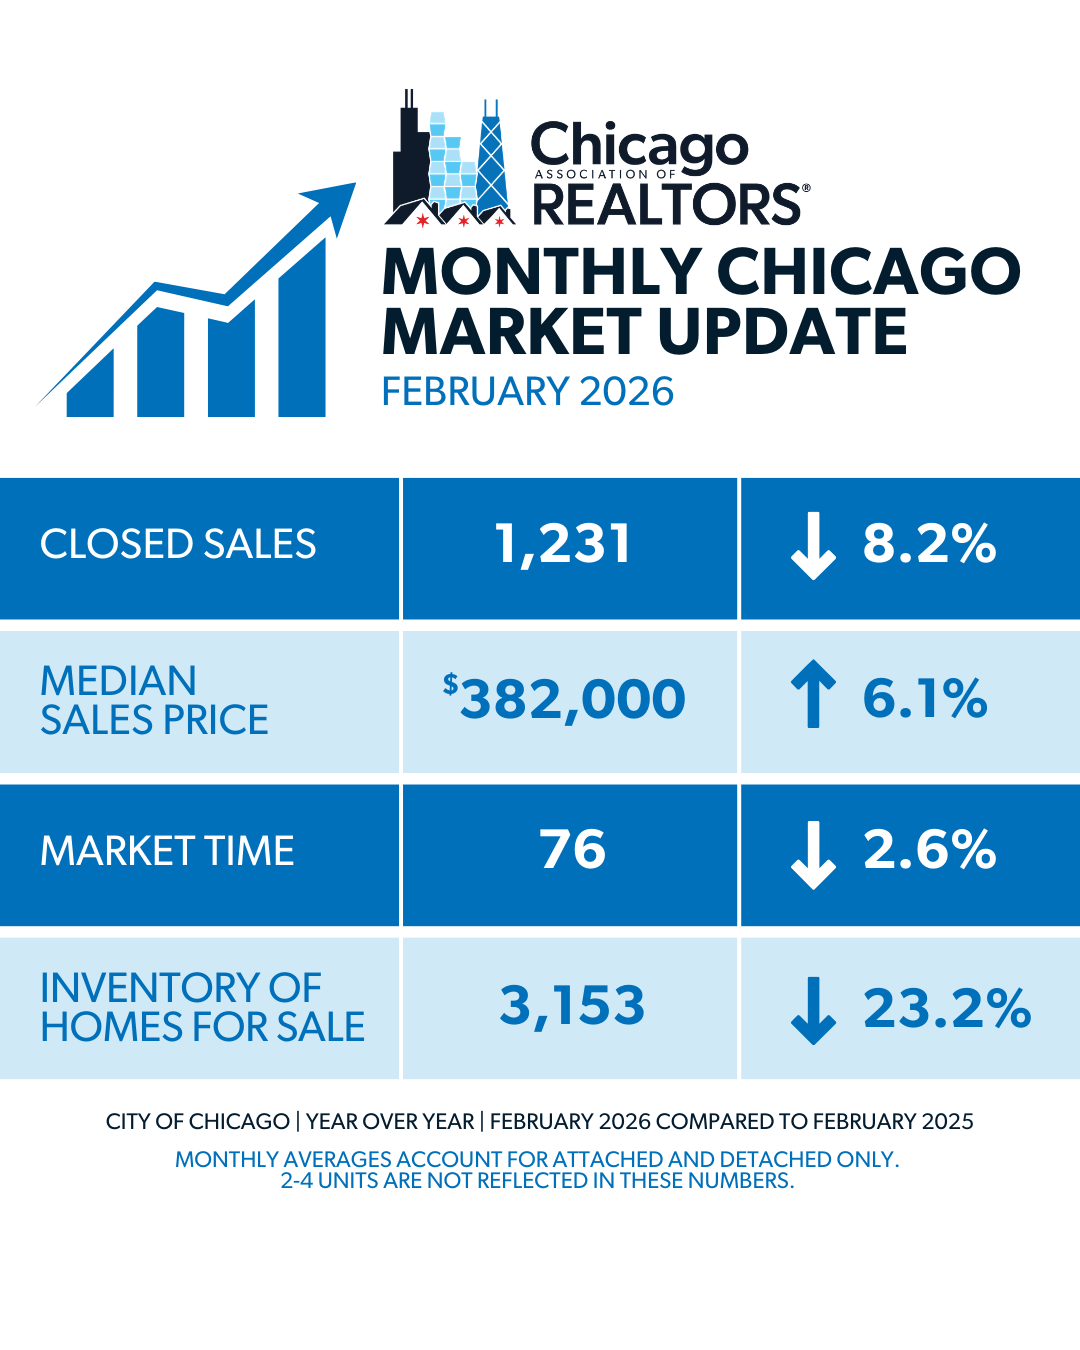
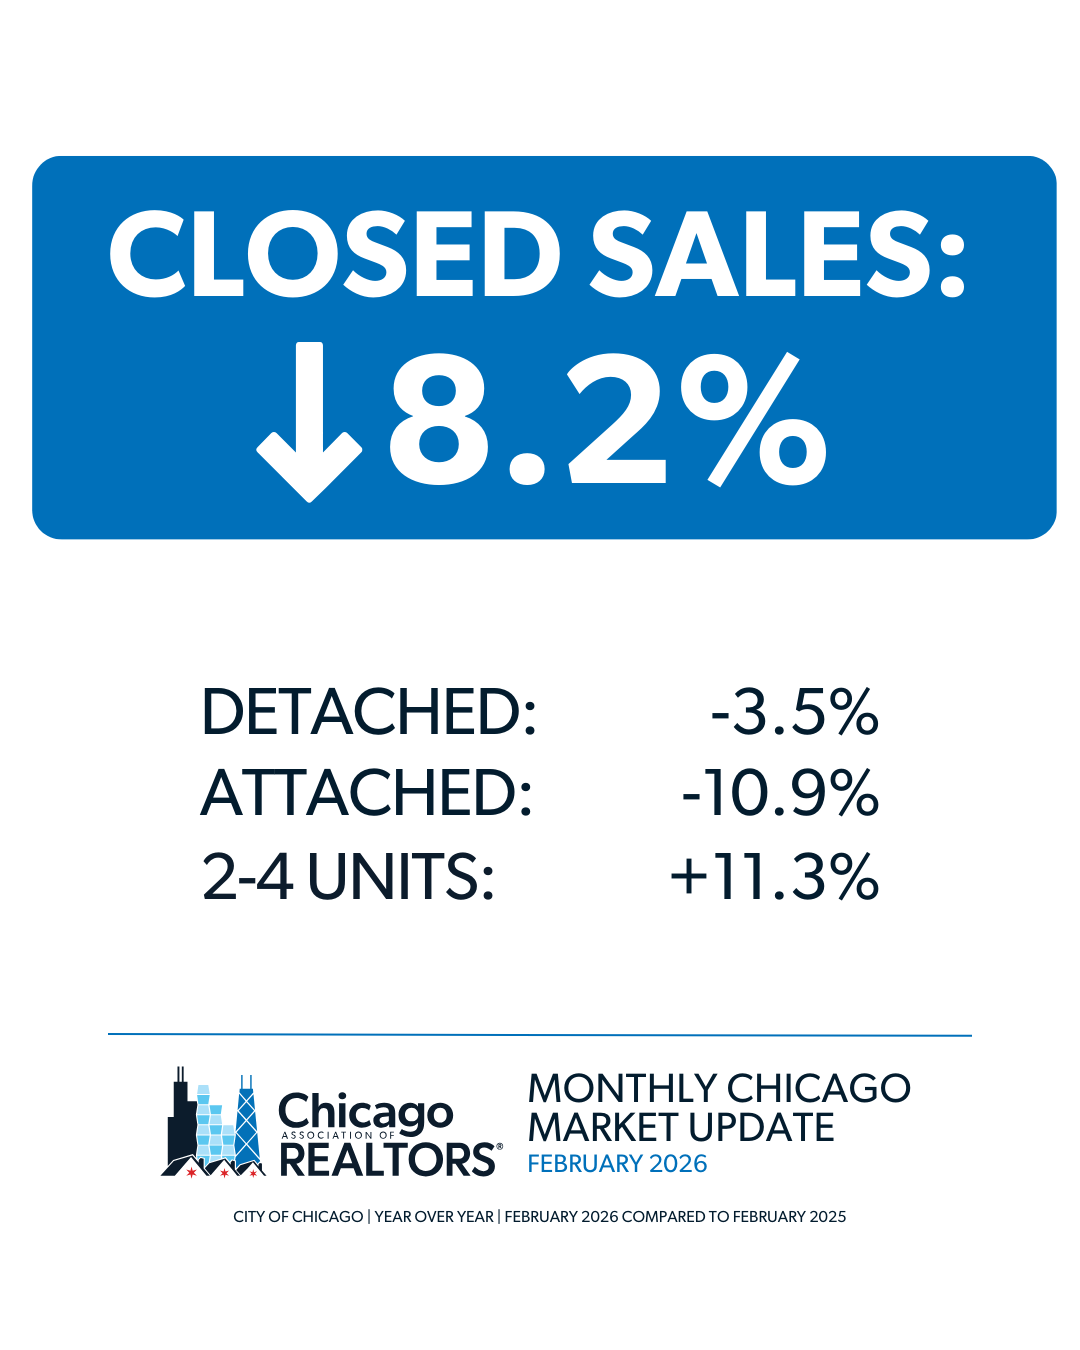
- 1,231 properties were sold in the City of Chicago in February 2026. This is a 8.2% decrease from February 2025.
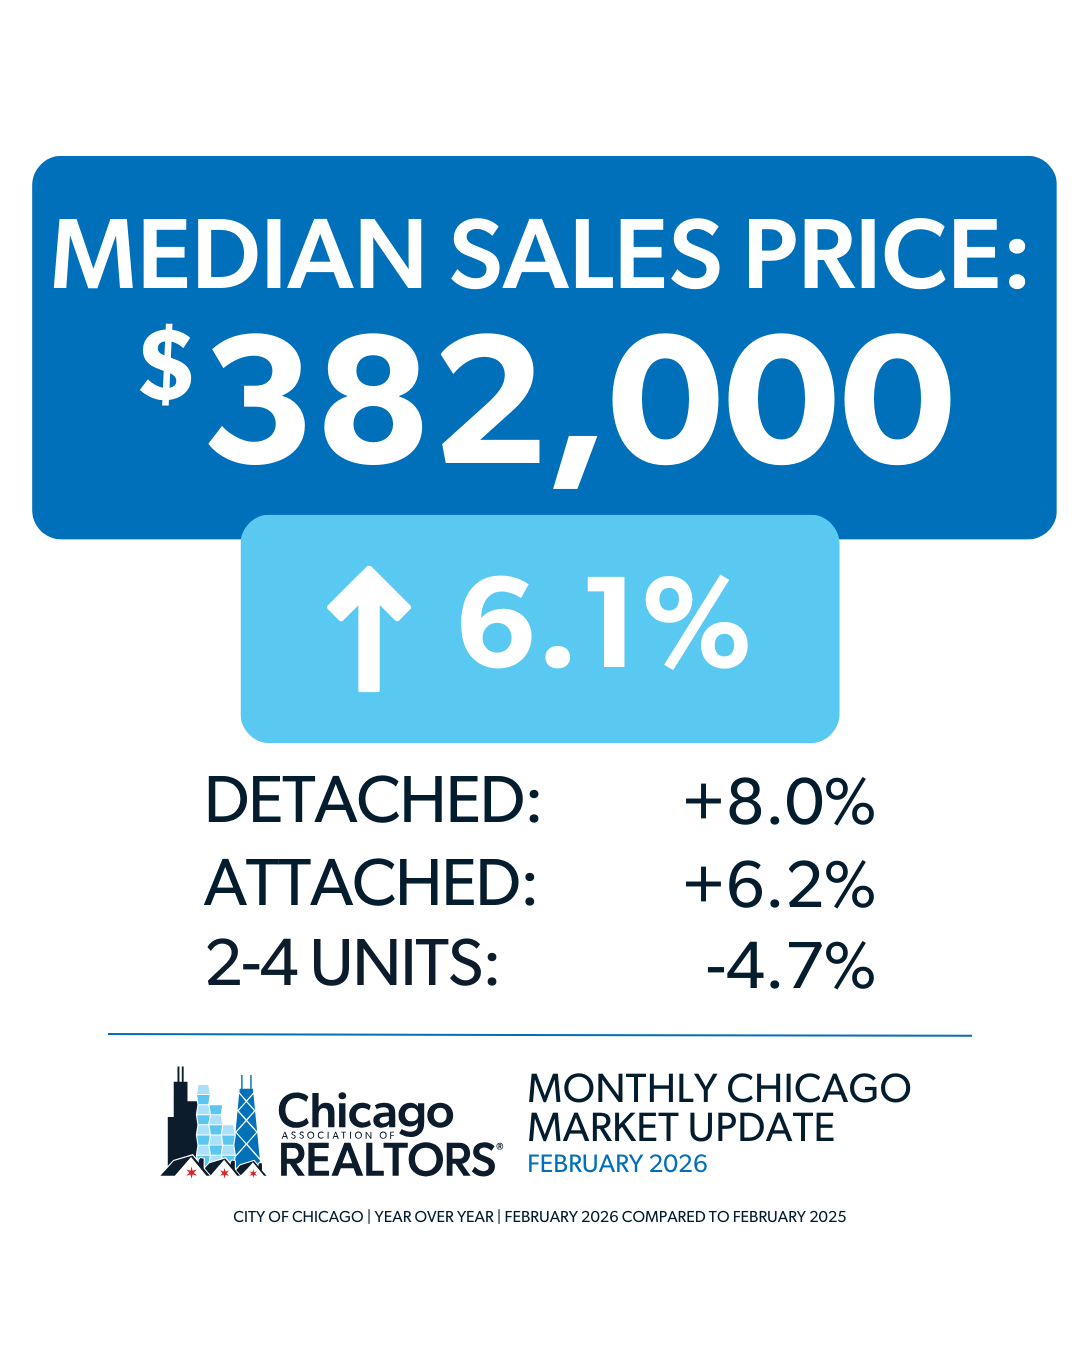
- The median sales price in the City of Chicago for February 2026 was $382,000, which is a 6.1% increase from February 2025.
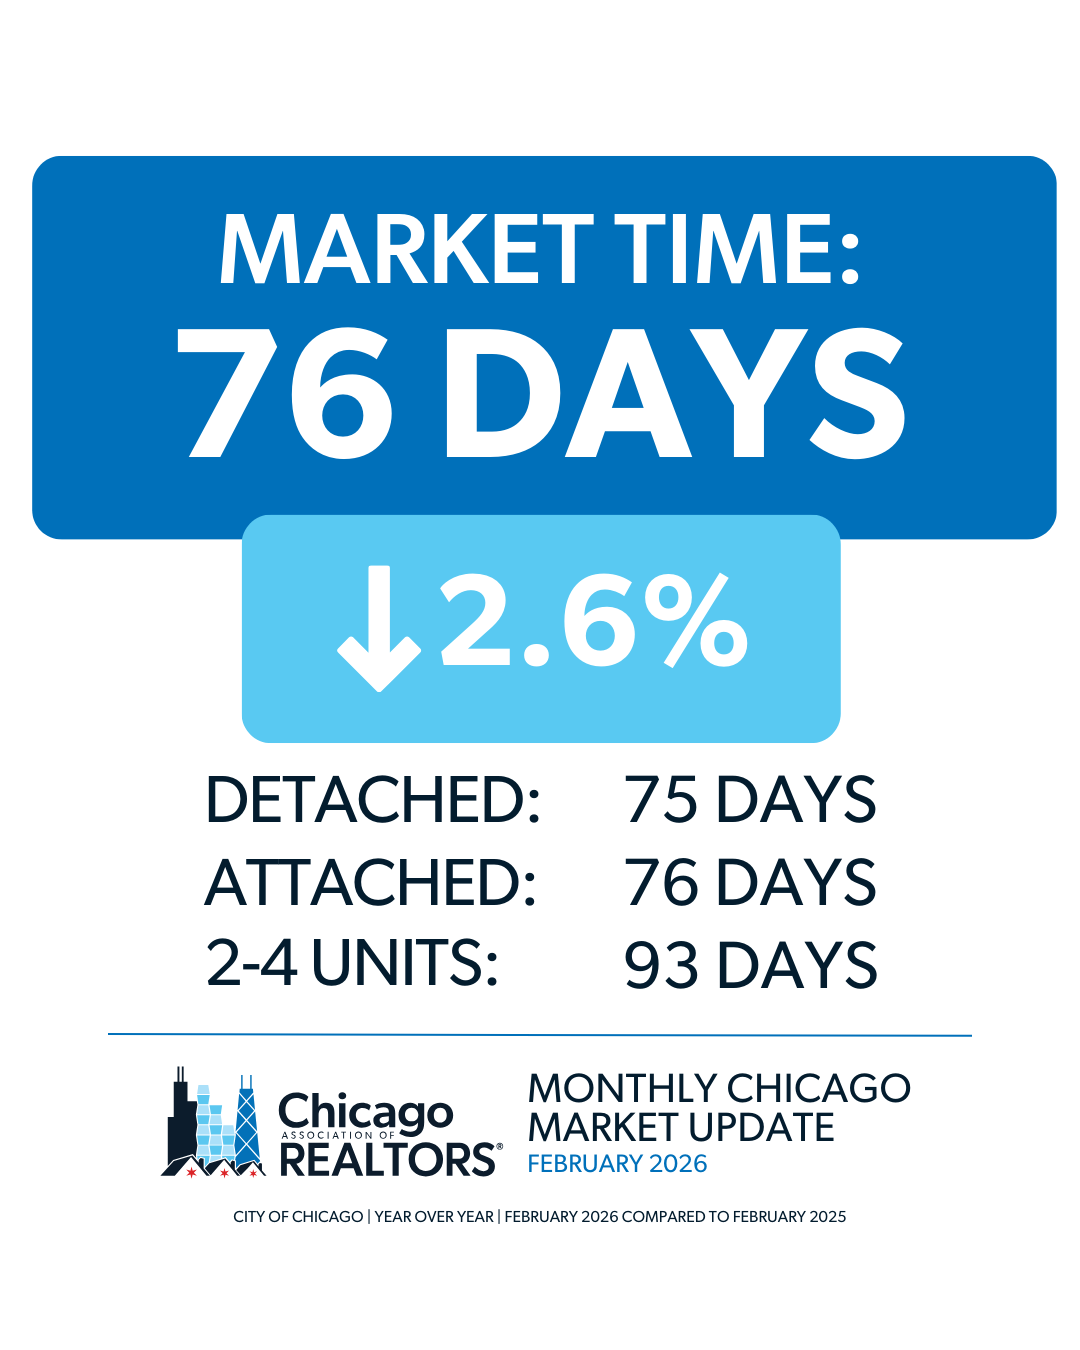
- The City of Chicago saw listings average 76 days on the market until contract, which is a 2.6% decrease from February 2025.
- Check out the February 2026 FastStats.
STATE OF THE MARKET
- Despite improving affordability conditions, U.S. existing-home sales declined 8.4% to a seasonally adjusted annual rate of 3.91 million, a 4.4% drop from one year earlier, according to the National Association of REALTORS® (NAR). The slowdown followed a 5.1% increase the previous month and modest gains throughout the fall. Sales retreated month-over-month and year-over-year in all four regions.
- Nationally, the median existing-home price inched up 0.9% year-over-year to $396,800, a new high for the month, NAR reported. Home prices have continued to rise across much of the country, in part due to low supply, which remains below pre-pandemic levels. Total housing inventory stood at 1.22 million units as of the most recent reading, up 3.4% from one year earlier, representing a 3.7-month supply at the current sales pace.
INVENTORY
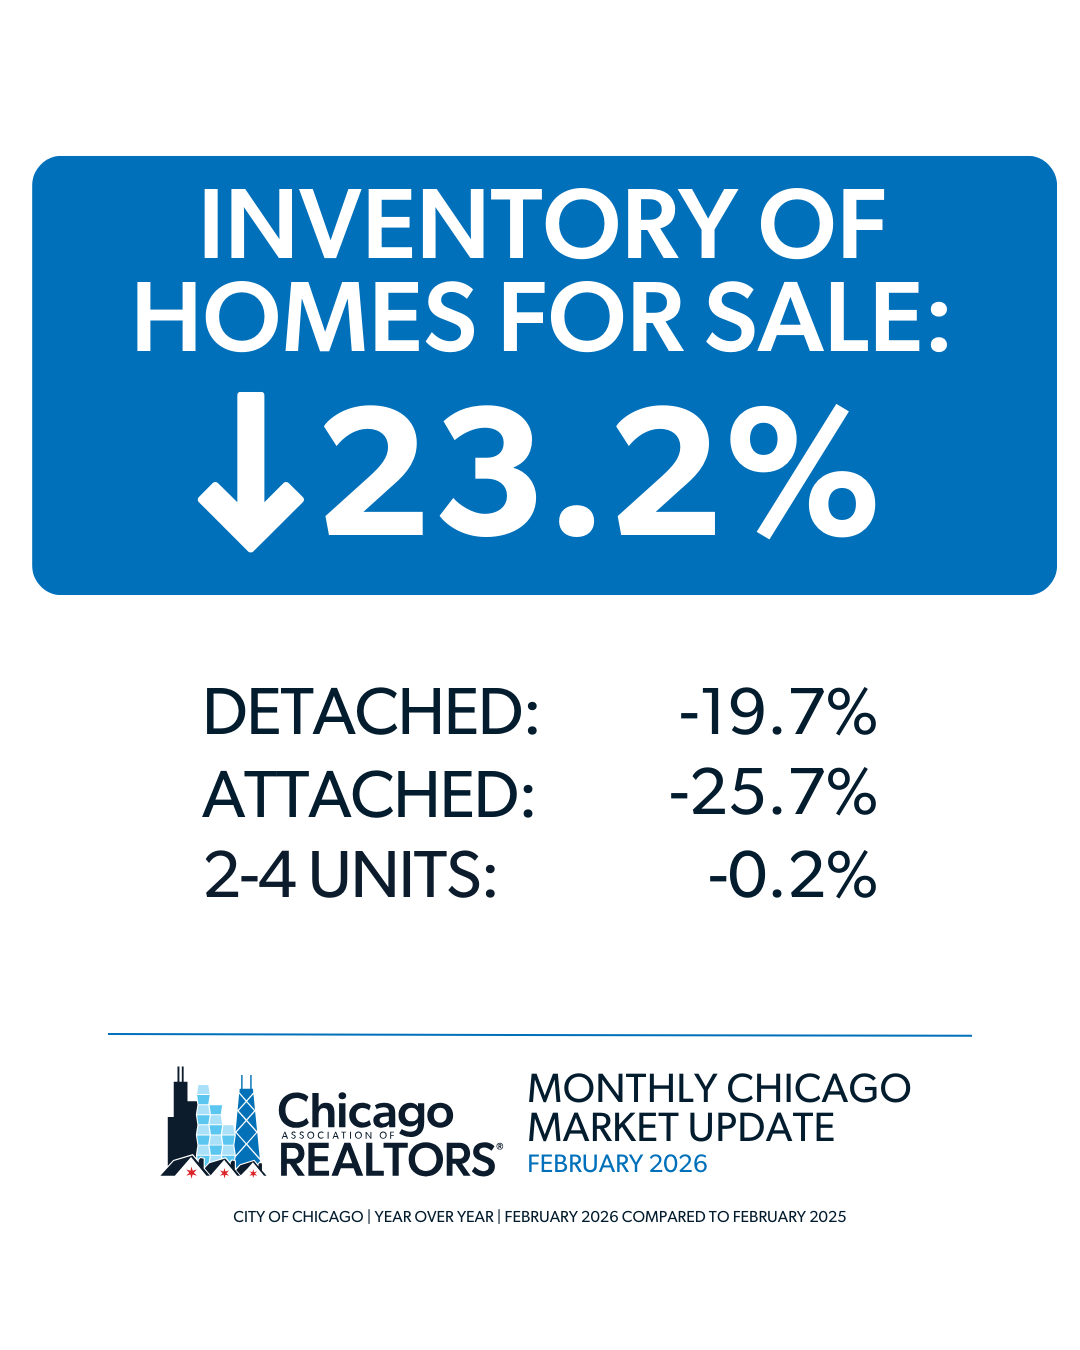
- The City of Chicago’s inventory is down 23.2%, from 4,106 homes in February 2025 to 3,153 homes in February 2026.
- The month’s supply of inventory decreased 22.7%, from 2.2 in February 2025 to 1.7 in February 2026.
2-4 Unit Data
- 197 properties were sold in February 2026. This is an 11.3% increase from February 2025.
- The median sales price in February 2026 was $405,000, a 4.7% decrease from February 2025.
- There were 449 new units on the market in February 2026, which is a 0.2% decrease from February 2025.
If you’re interested in exploring all the 2-4 unit data, check out our monthly spreadsheets in the Chicago-MU tab.