


*The City of Chicago Market Snapshot represents the residential real estate activity within the 77 officially defined Chicago community areas as provided by the Chicago Association of REALTORS®.
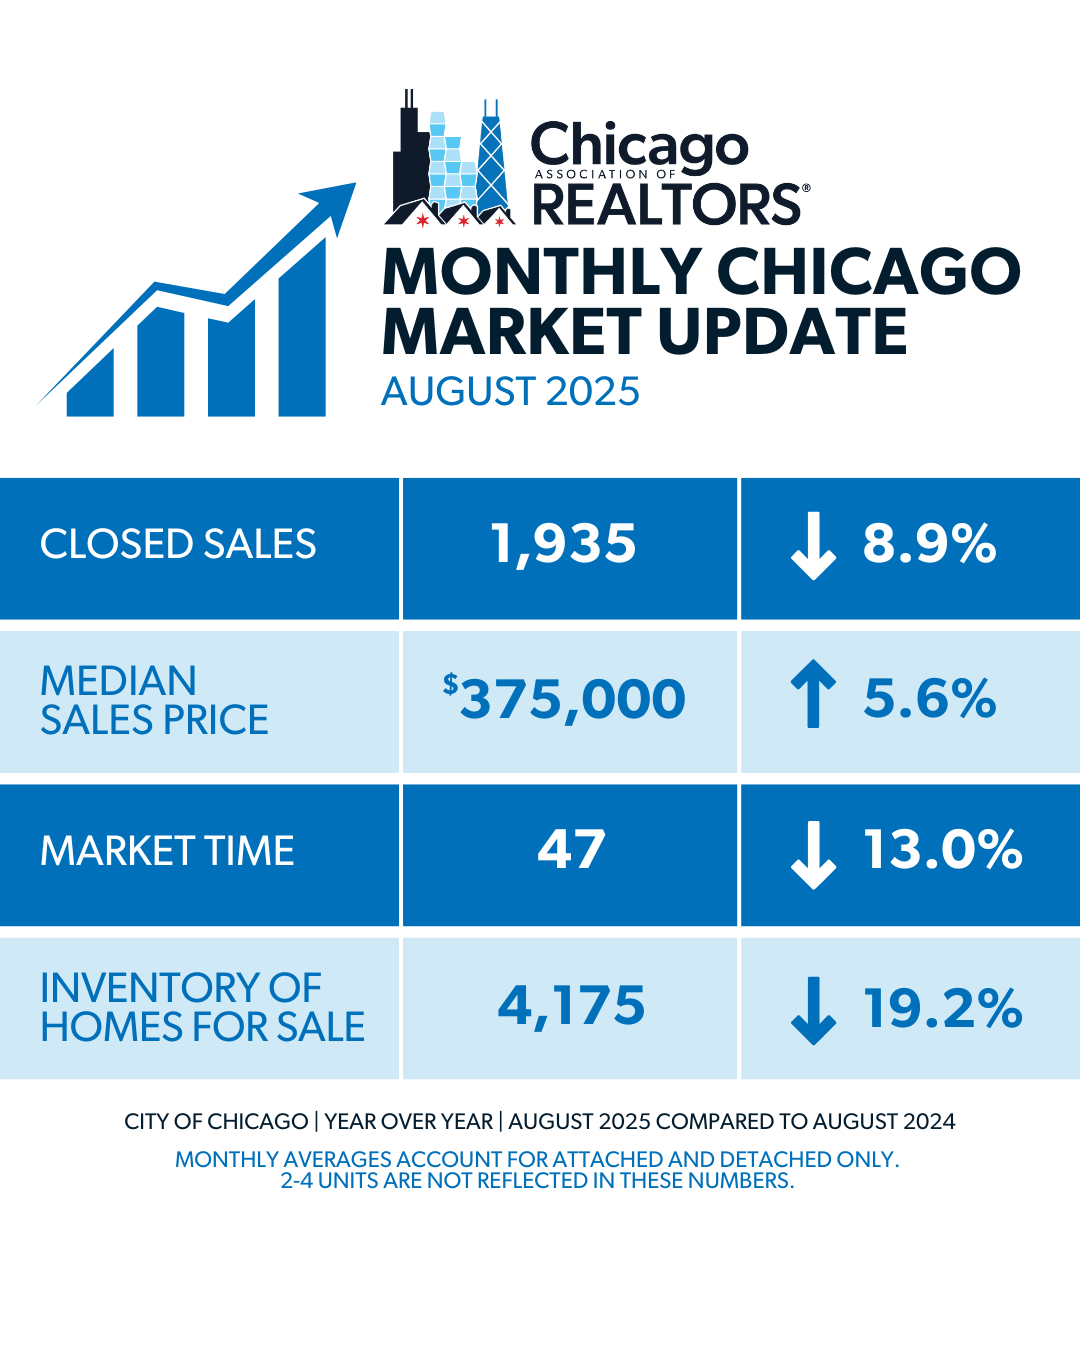
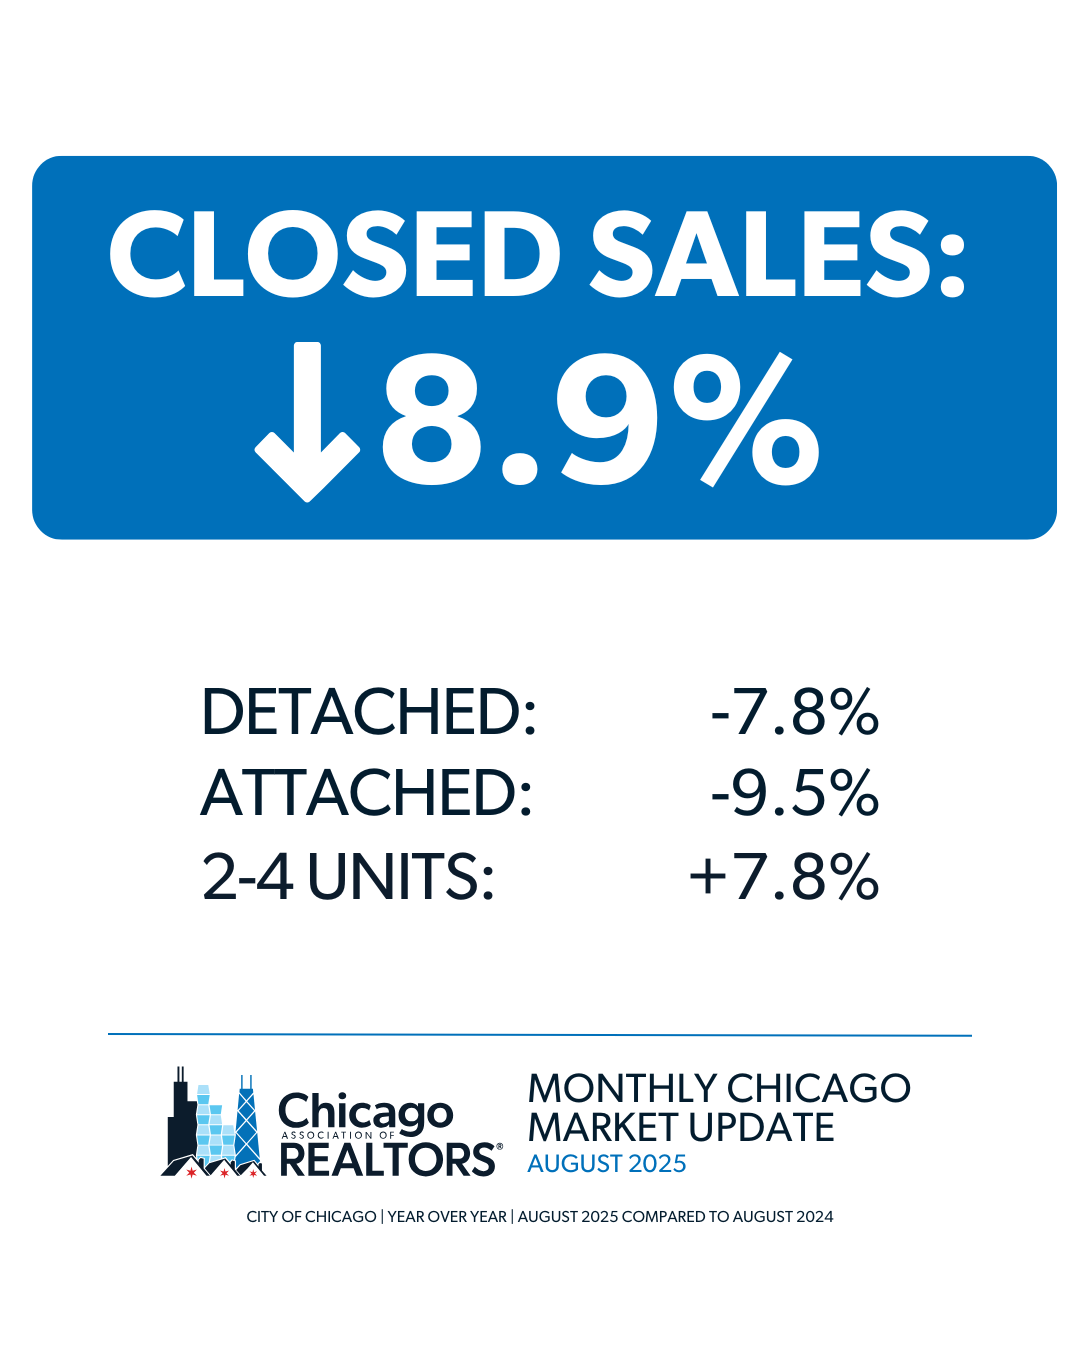
- 1,935 properties were sold in the City of Chicago in August 2025. This is an 8.9% decrease from August 2024.
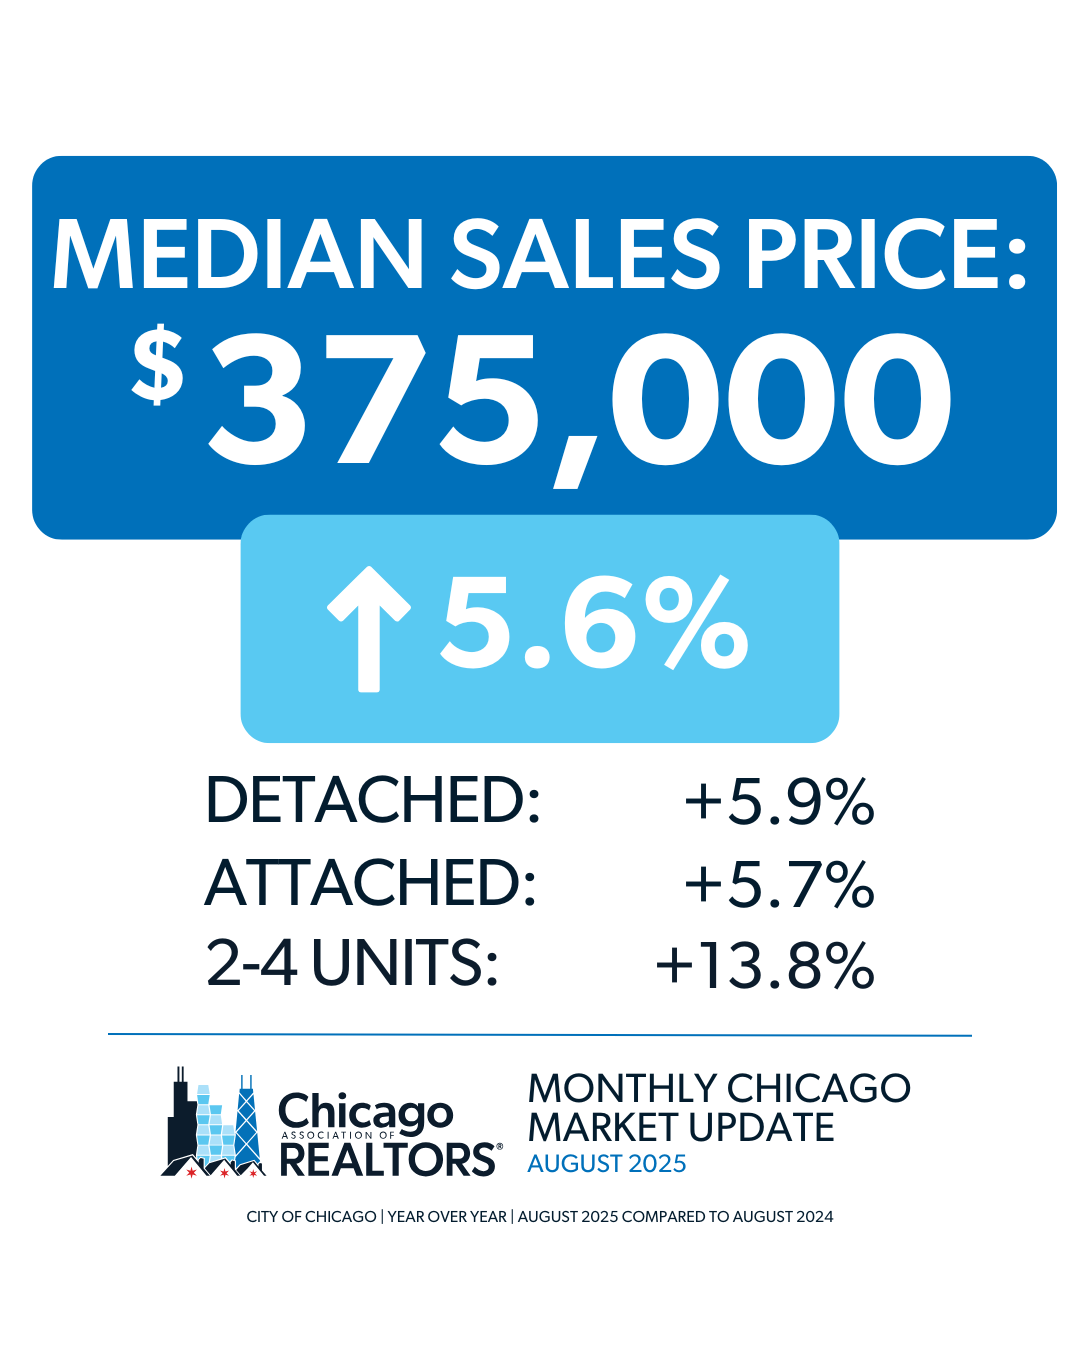
- The median sales price in the City of Chicago for August 2025 was $375,000, which is a 5.6% increase from August 2024.
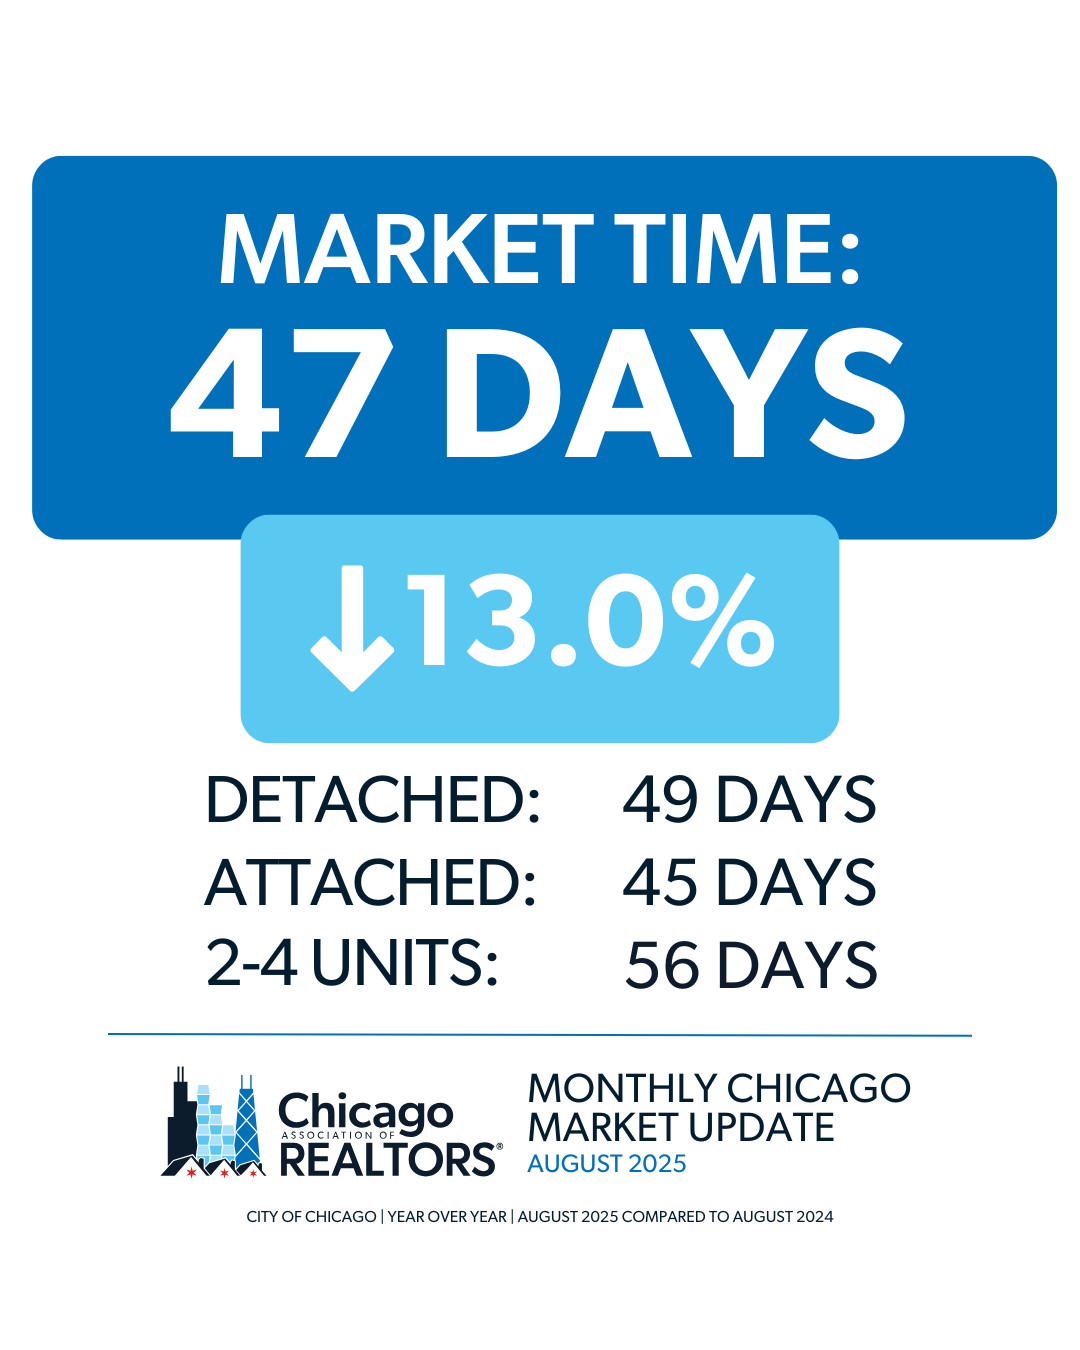
- The City of Chicago saw listings average 47 days on the market until contract, which is a 13.0% decrease from August 2024.
- Check out the August 2025 FastStats.
STATE OF THE MARKET
- U.S. existing-home sales rose 2.0% month-over-month and 0.8% year-over-year to a seasonally adjusted annual rate of 4.01 million units, according to the National Association of REALTORS® (NAR). Economists polled by Reuters had forecast a rate of 3.92 million units. Regionally, sales increased on a monthly basis in the West, South, and Northeast, but declined in the Midwest.
- Nationally, 1.55 million units were listed for sale heading into August, up 0.6% from the previous month and 15.7% higher than the same time last year, representing a 4.6-month supply at the current sales pace, according to NAR. Inventory is now at its highest level since May 2020, a shift that has helped slow price growth in many markets. As a result, the national median existing-home sales price edged up just 0.2% year-over-year to $422,400.
INVENTORY
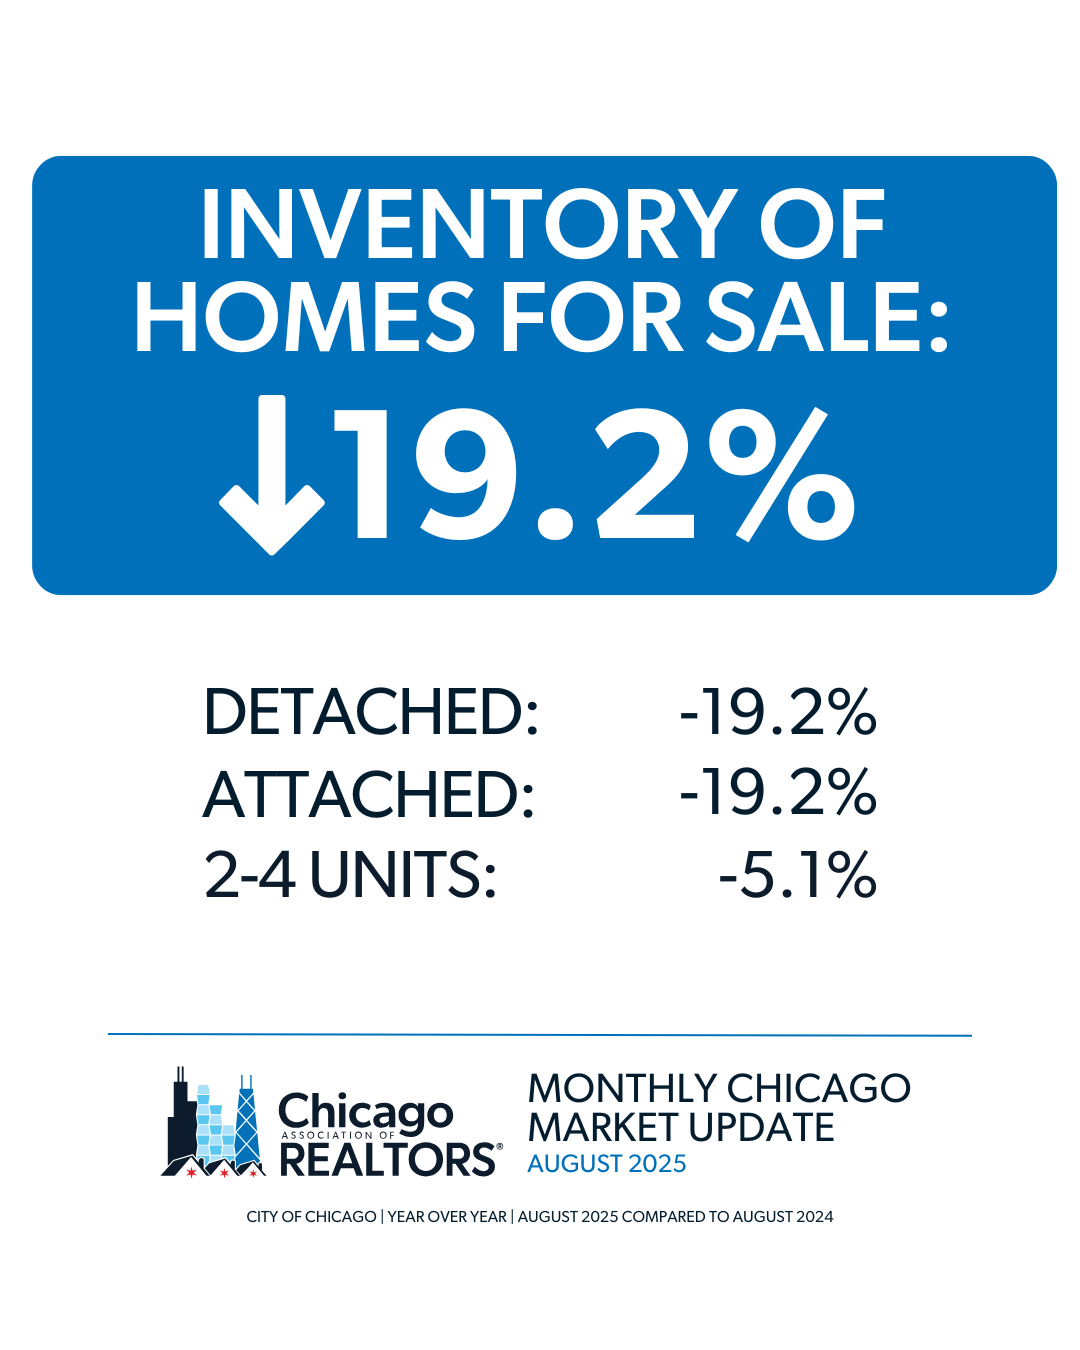
- The City of Chicago’s inventory is down 19.2%, from 5,168 homes in August 2024 to 4,175 homes in August 2025.
- The month’s supply of inventory decreased 17.9%, from 2.8 in August 2024 to 2.3 in August 2025.
2-4 Unit Data
- 318 properties were sold in August 2025. This is a 7.8% increase from August 2024.
- The median sales price in August 2025 was $457,500, a 13.8% increase from August 2024.
- There were 542 new units on the market in August 2025, which is a 5.1% decrease from August 2024.
If you’re interested in exploring all the 2-4 unit data, check out our monthly spreadsheets in the Chicago-MU tab.