


*The City of Chicago Market Snapshot represents the residential real estate activity within the 77 officially defined Chicago community areas as provided by the Chicago Association of REALTORS®.
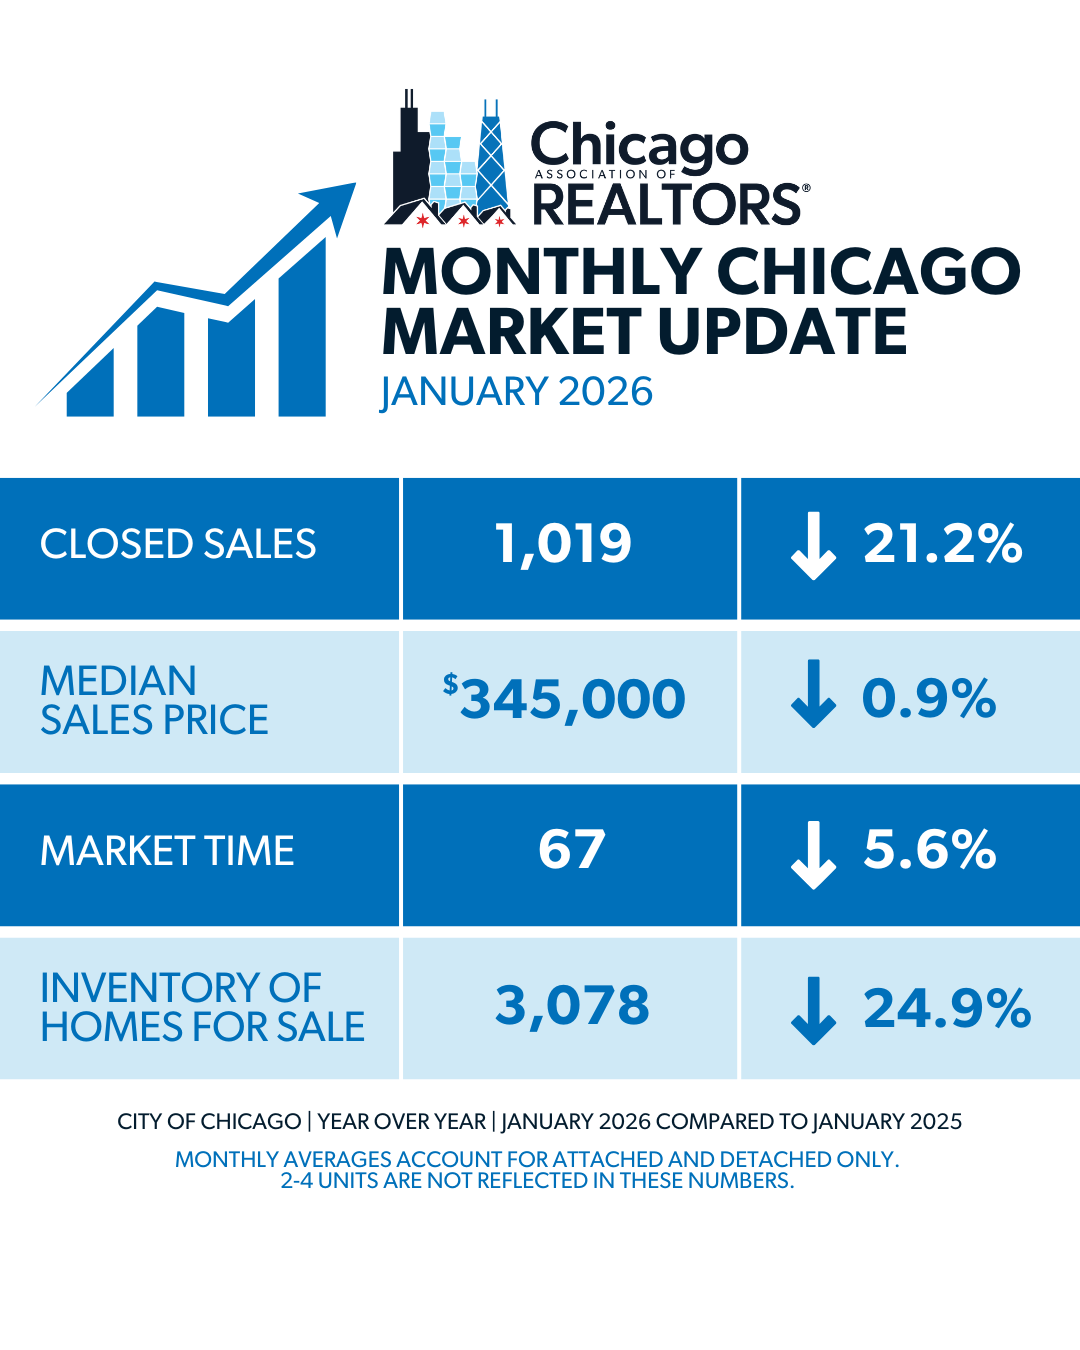
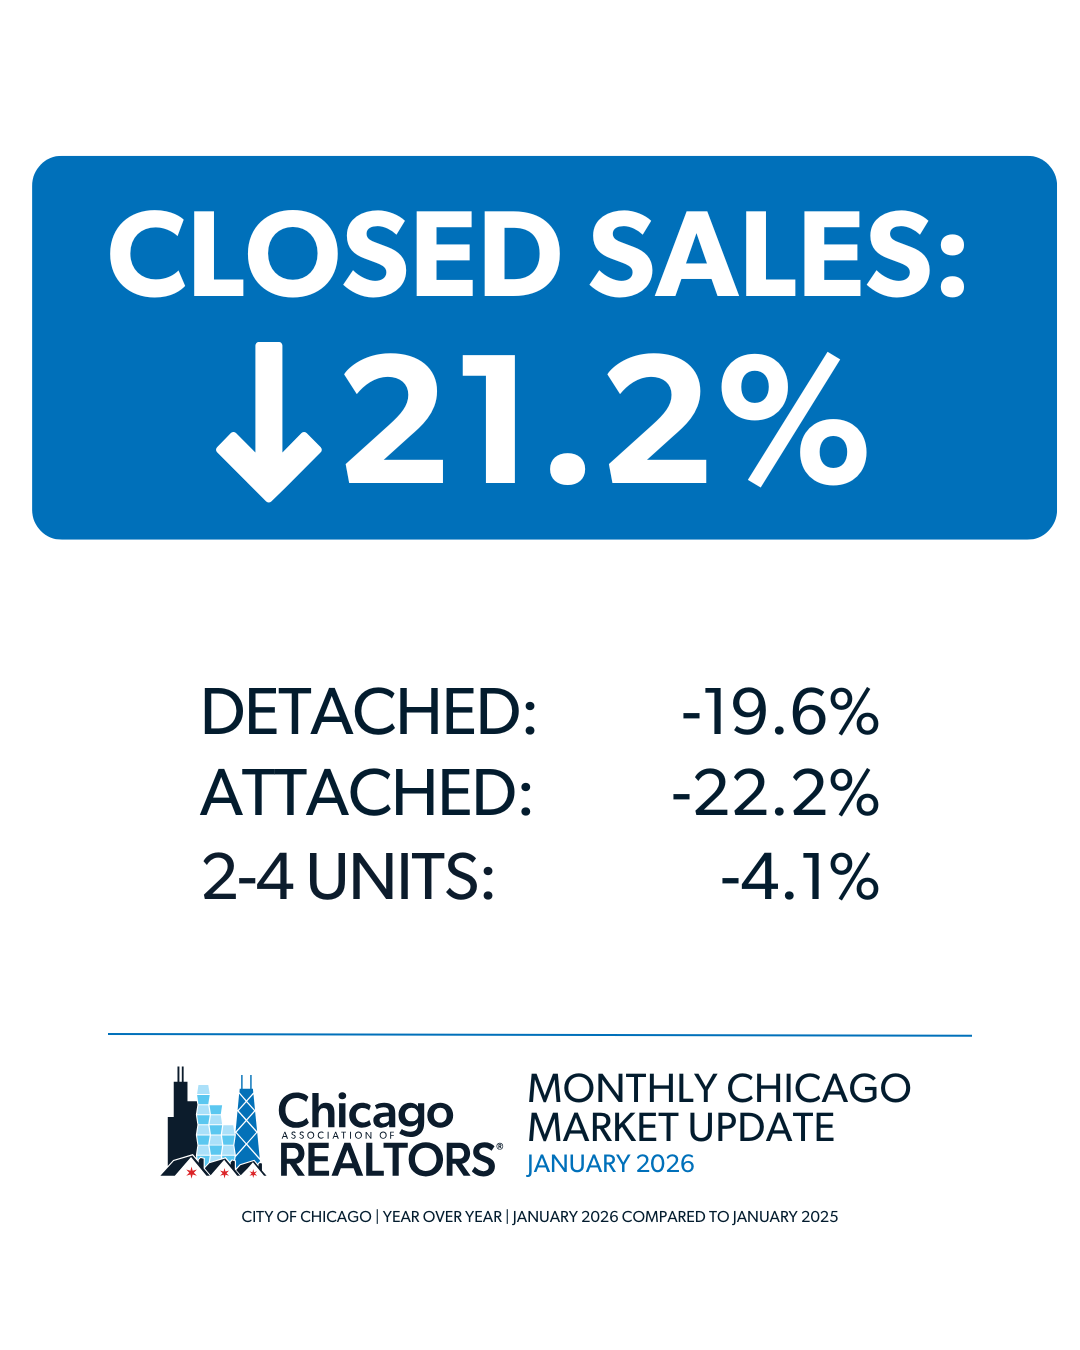
- 1,019 properties were sold in the City of Chicago in January 2026. This is a 21.2% decrease from January 2025.
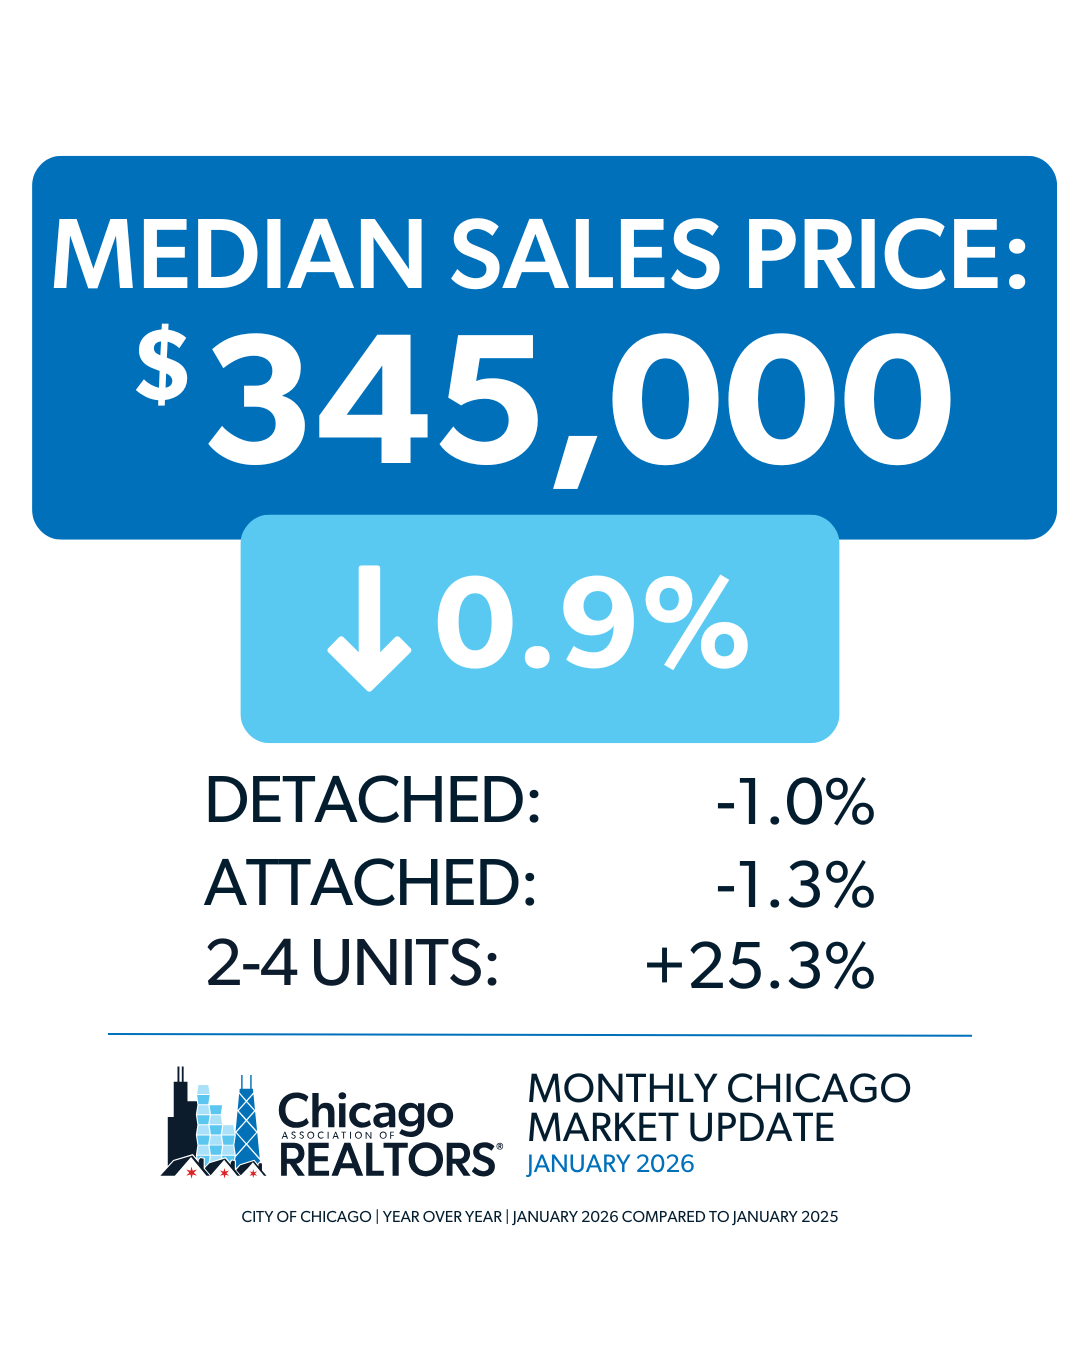
- The median sales price in the City of Chicago for January 2026 was $345,000, which is a 0.9% decrease from January 2025.
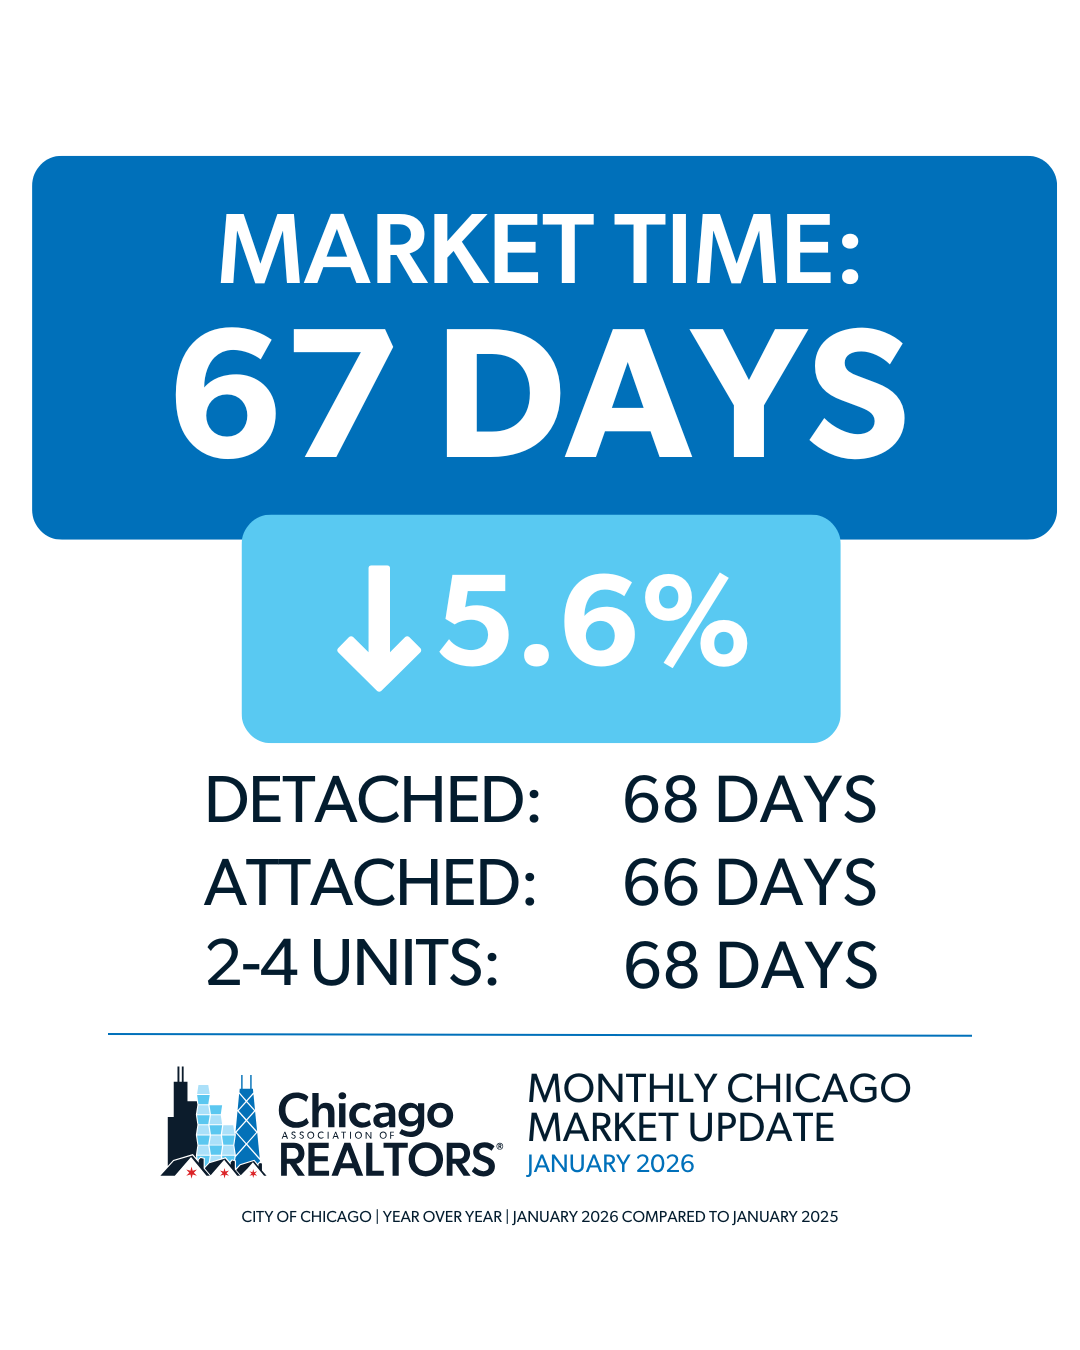
- The City of Chicago saw listings average 67 days on the market until contract, which is a 5.6% decrease from January 2025.
- Check out the January 2026 FastStats.
STATE OF THE MARKET
- U.S. existing-home sales climbed 5.1% month-over-month and 1.4% year-over-year to a seasonally adjusted annual rate of 4.35 million units, the strongest pace in nearly three years, according to the National Association of REALTORS® (NAR). Lower mortgage rates and slower home price growth helped spur buyer activity, and sales increased month-over-month in every region. On an annual basis, sales rose in the South, held steady in the West and Midwest, and declined in the Northeast.
- Nationally, there were 1.18 million homes for sale heading into January, an 18.1% decline from the previous month but 3.5% higher compared to the same period last year, representing a 3.3-month supply at the current sales pace, according to NAR. Meanwhile, the median existing-home price rose 0.4% from a year ago to $405,400, reflecting a continued moderation in national price growth.
INVENTORY
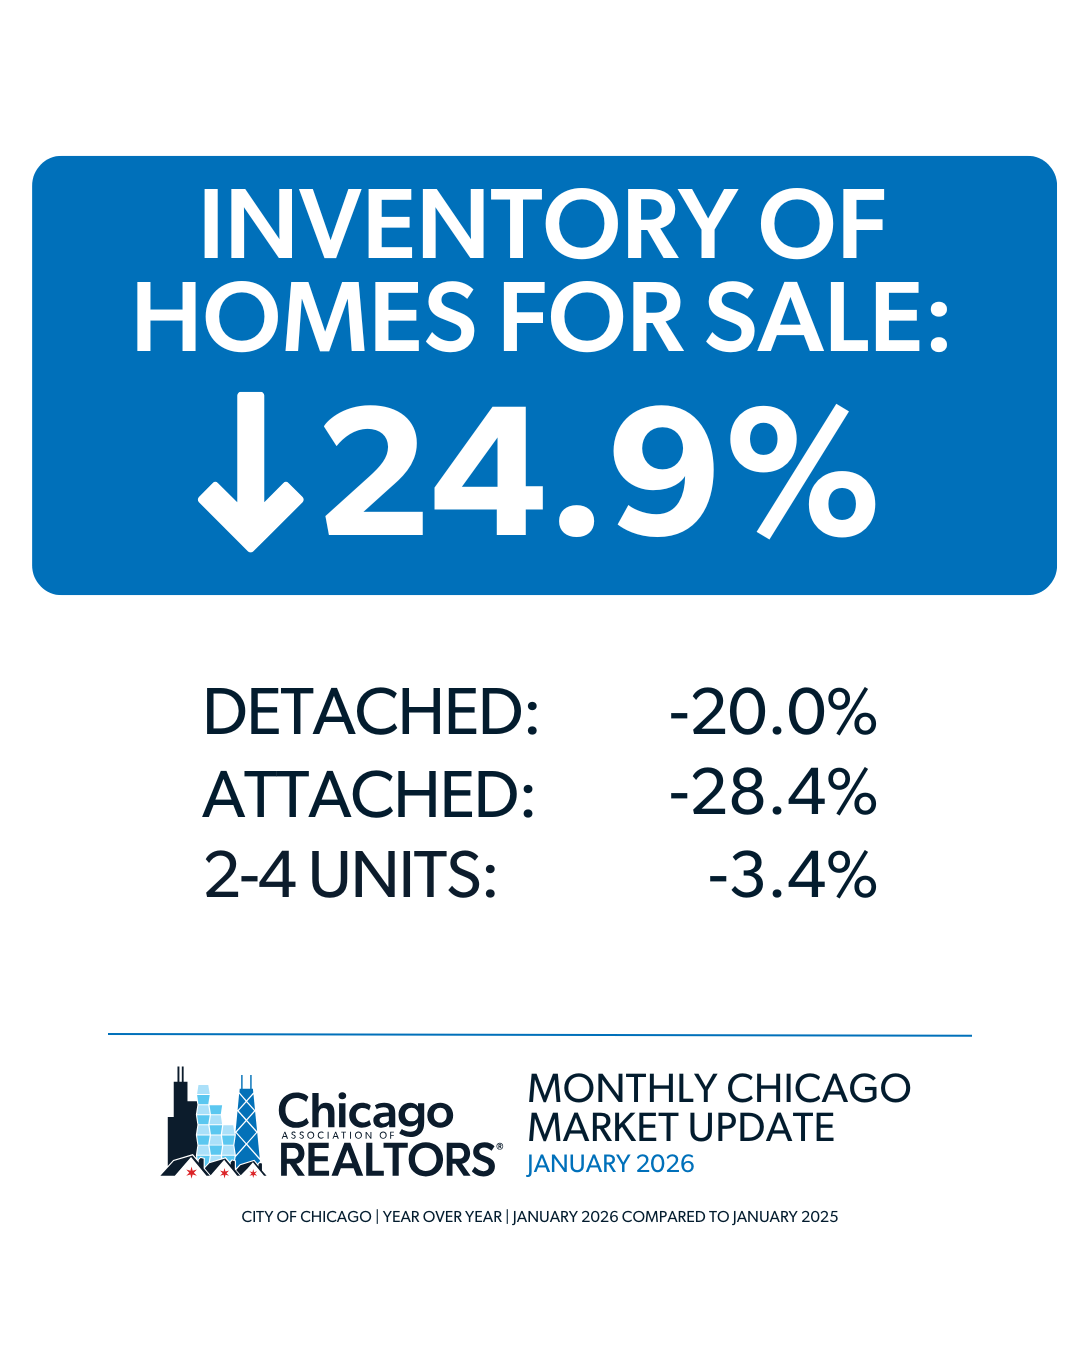
- The City of Chicago’s inventory is down 24.9%, from 4,097 homes in January 2025 to 3,078 homes in January 2026.
- The month’s supply of inventory decreased 22.7%, from 2.2 in January 2025 to 1.7 in January 2026.
2-4 Unit Data
- 210 properties were sold in January 2026. This is a 4.1% decrease from January 2025.
- The median sales price in January 2026 was $475,000, a 25.3% increase from January 2025.
- There were 451 new units on the market in January 2026, which is a 3.4% decrease from January 2025.
If you’re interested in exploring all the 2-4 unit data, check out our monthly spreadsheets in the Chicago-MU tab.