


*The City of Chicago Market Snapshot represents the residential real estate activity within the 77 officially defined Chicago community areas as provided by the Chicago Association of REALTORS®.
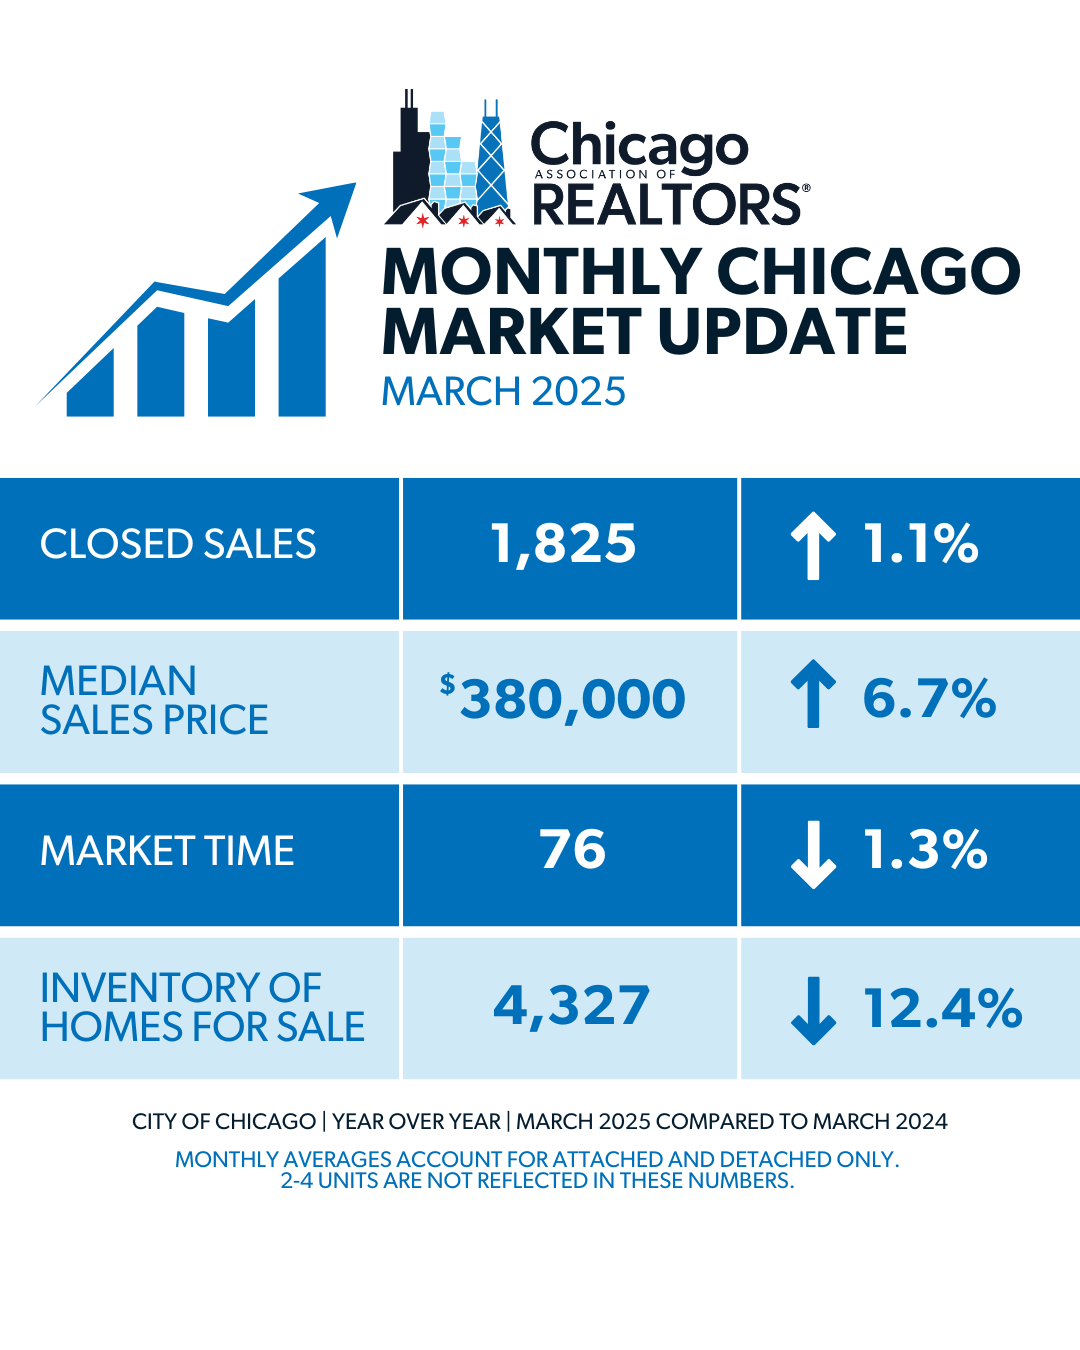
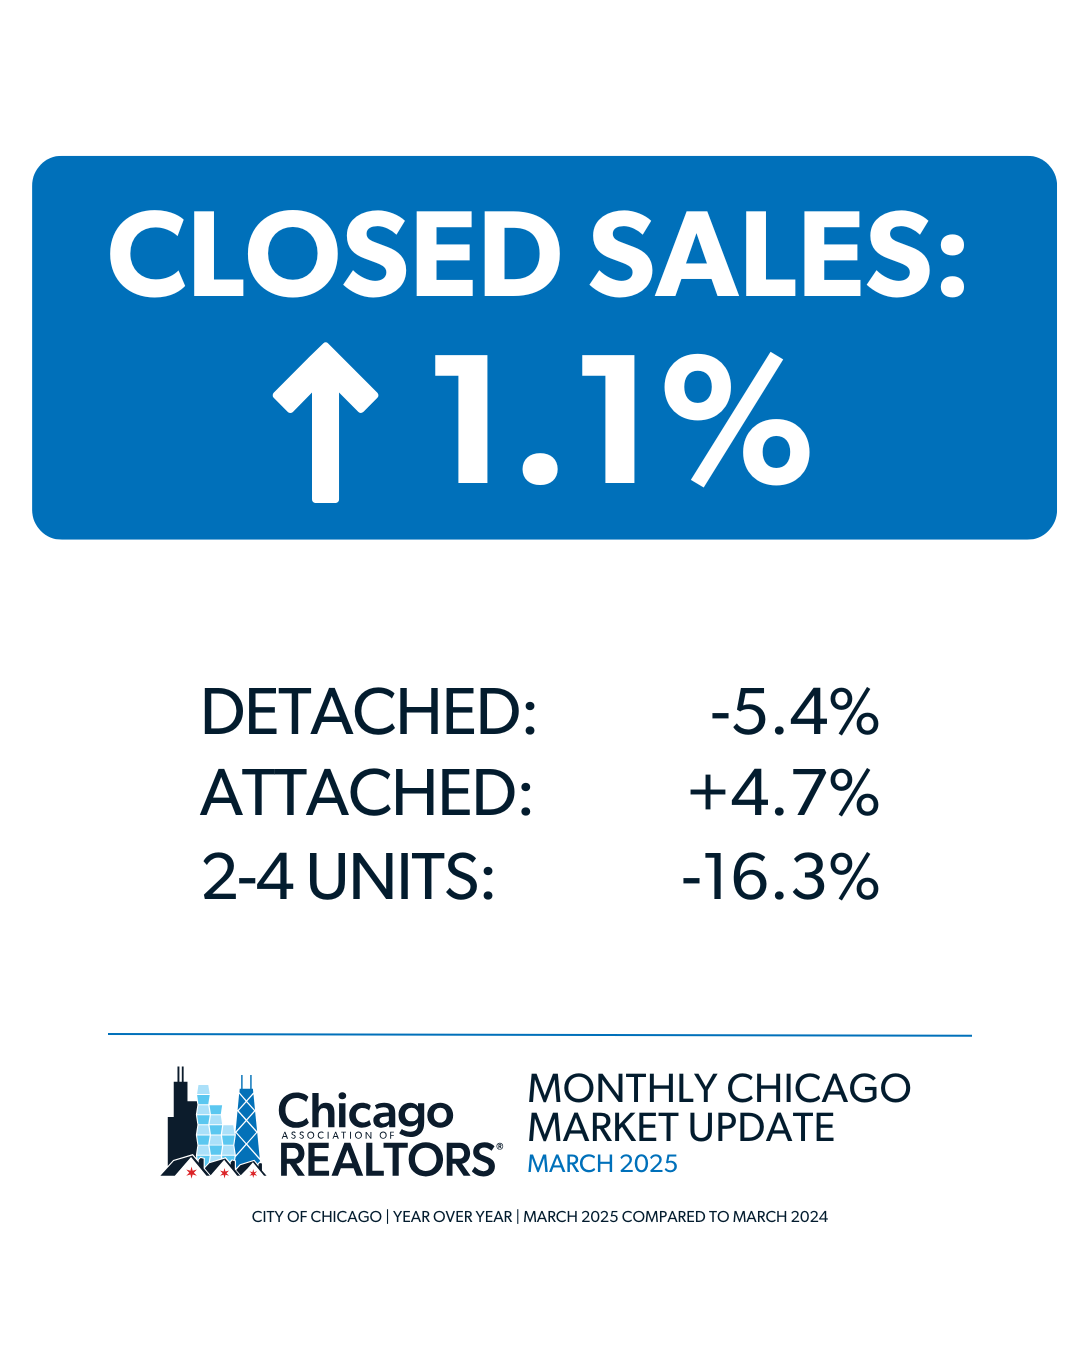
- 1,825 properties were sold in the City of Chicago in March 2025. This is a 1.1% increase from March 2024.
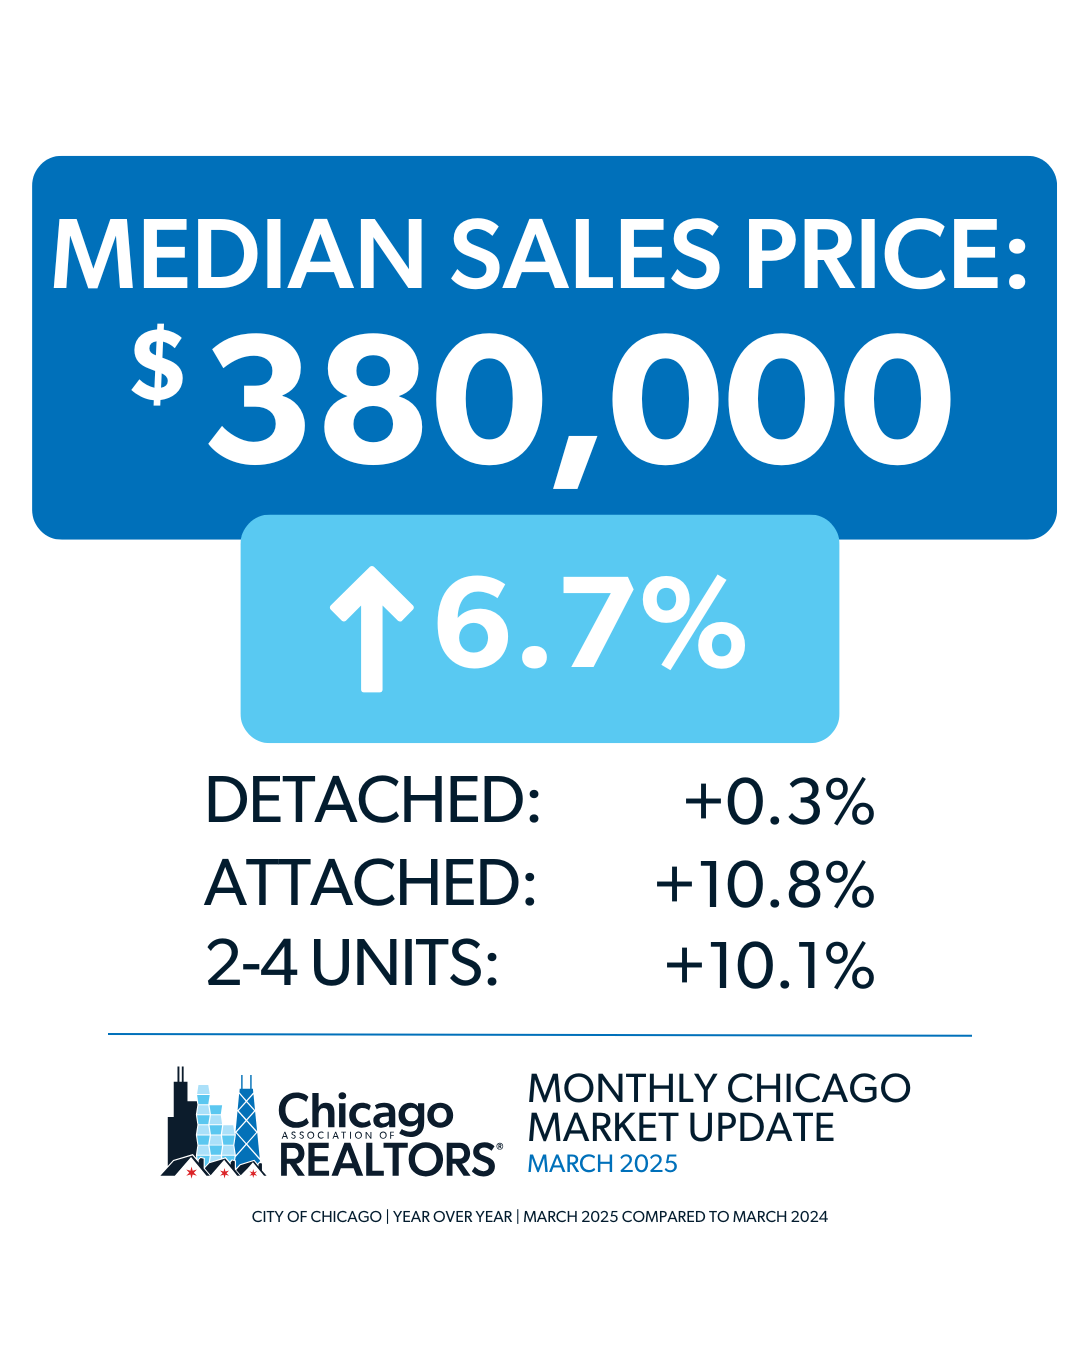
- The median sales price in the City of Chicago for March 2025 was $380,000, which is a 6.7% increase from March 2024.
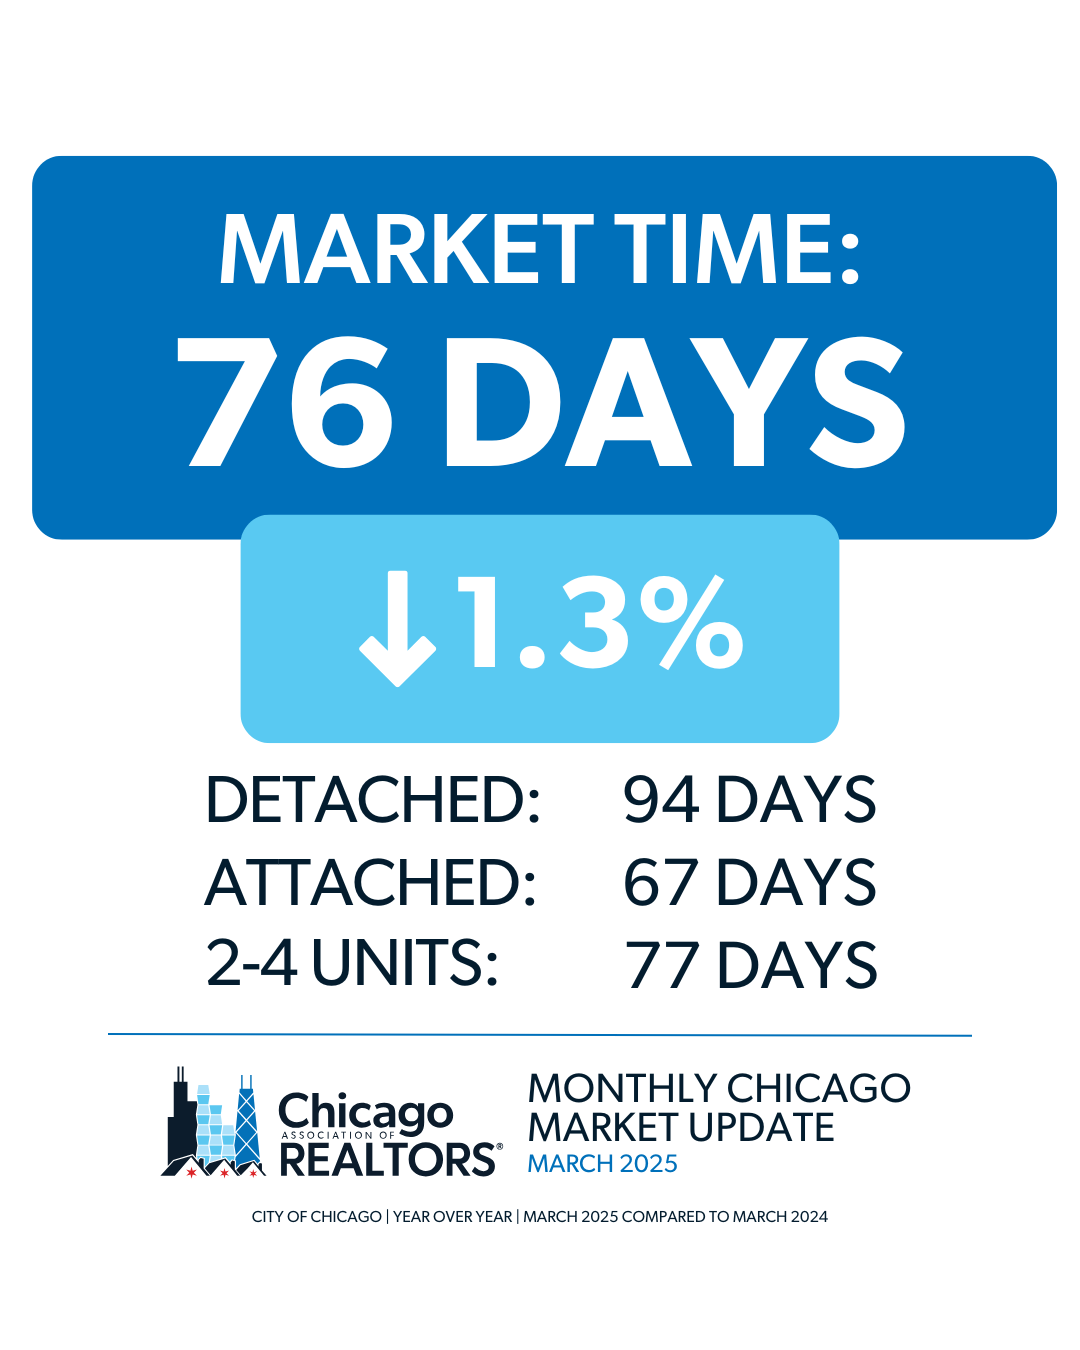
- The City of Chicago saw listings average 76 days on the market until contract, which is a 1.3% decrease from March 2024.
- Check out the March 2025 FastStats.
STATE OF THE MARKET
- U.S. existing-home sales rebounded from the previous month, rising 4.2% to a seasonally adjusted annual rate of 4.26 million units, according to the National Association of REALTORS® (NAR). Economists polled by Reuters had forecast sales would fall to a rate of 3.95 million for the month. Purchase activity increased in the South and the West but decreased in the Northeast, while sales in the Midwest remained unchanged from one month earlier.
- Heading into March there were 1.24 million properties for sale, a 5.1% increase from the previous month and a 17% jump from one year ago, for a 3.5-month supply at the current sales pace, according to NAR. While mortgage rates have remained in the mid-to-high 6% range, the additional supply appears to have helped bring some buyers out of the woodwork, even as sales prices continue to rise nationwide.
INVENTORY
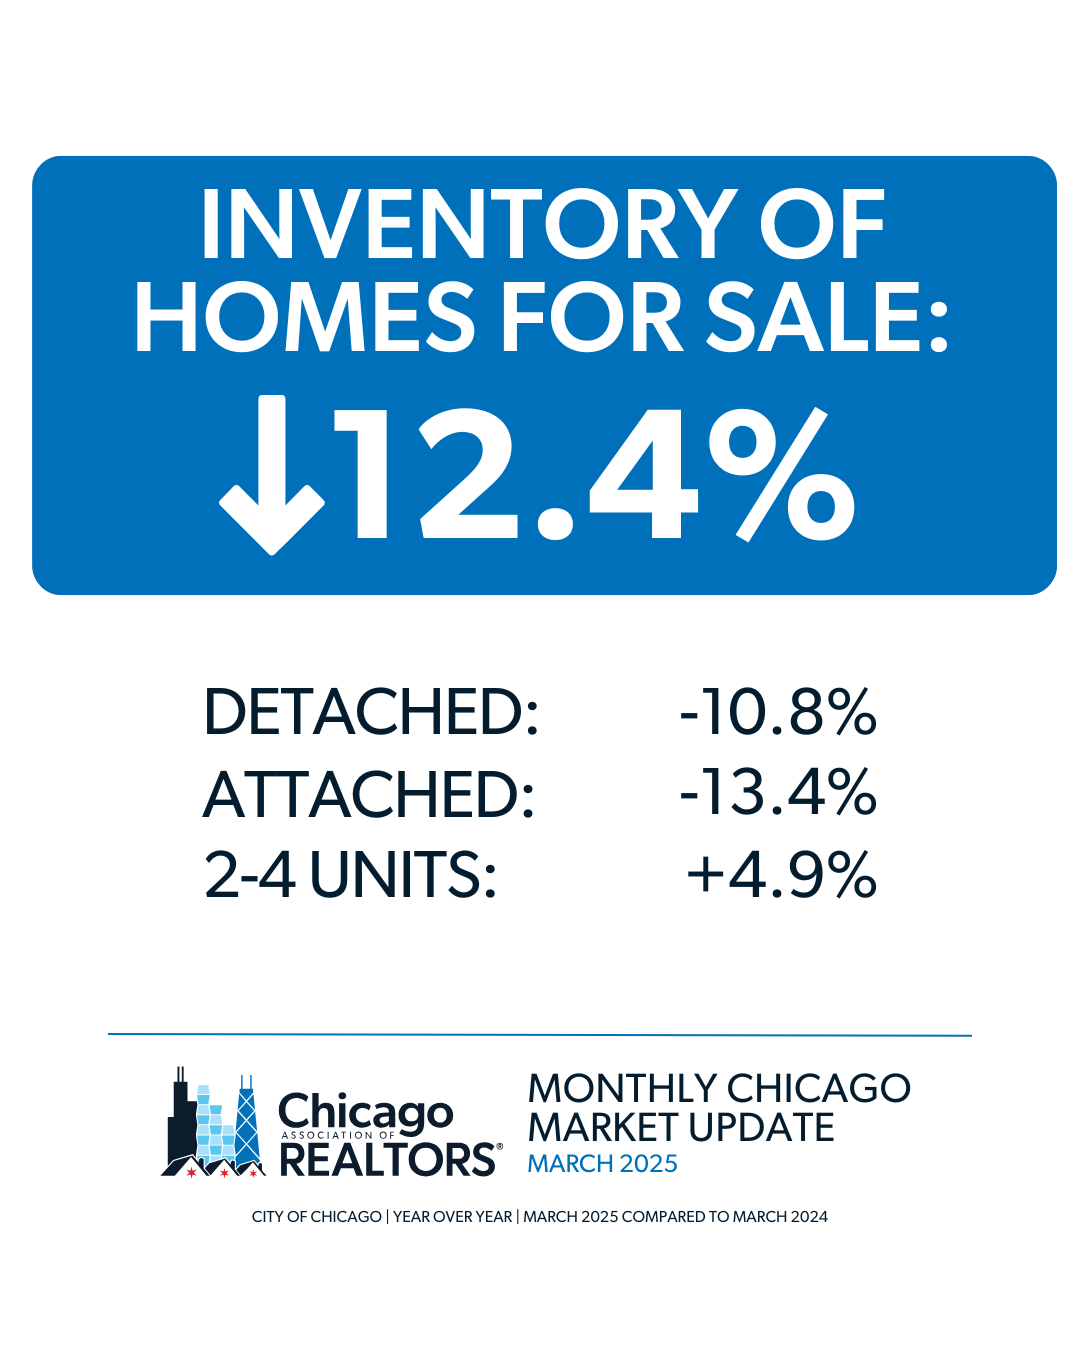
- The City of Chicago’s inventory is down 12.4%, from 4,939 homes in March 2024 to 4,327 homes in March 2025.
- The month’s supply of inventory decreased 14.8%, from 2.7 in March 2024 to 2.3 in March 2025.
2-4 Unit Data
- 229 properties were sold in March 2025. This is a 16.3% decrease from March 2024.
- The median sales price in March 2025 was $440,000, a 10.1% increase from March 2024.
- There were 562 new units on the market in March 2025, which is a 4.9% increase from March 2024.
If you’re interested in exploring all the 2-4 unit data, check out our monthly spreadsheets in the Chicago-MU tab.